
By Melinda Jennison – Managing Director Streamline Property Buyers
Introduction
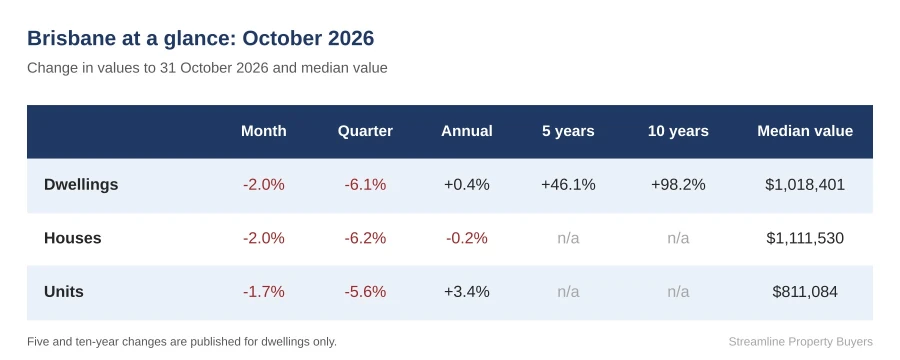
October delivered another month of softer numbers for Brisbane property, and there is no point pretending otherwise. Cotality recorded a 2.0% fall in Brisbane dwelling values over the month, taking the rolling three-month decline to 6.1%. Brisbane was the weakest-performing capital over October and, at face value, those numbers look confronting.
But I think this is one of those periods where the headline number needs to be read alongside everything else that is happening in the market.
The first thing to remember is that Brisbane is coming off an extraordinary period of growth. Even after the recent correction, dwelling values remain 46.1% higher than five years ago and 98.2% higher than 10 years ago. The current median dwelling value is $1,018,401. So while values have fallen from their May peak, most Brisbane homeowners who have owned for any reasonable period are still likely to be sitting on a very substantial equity buffer.
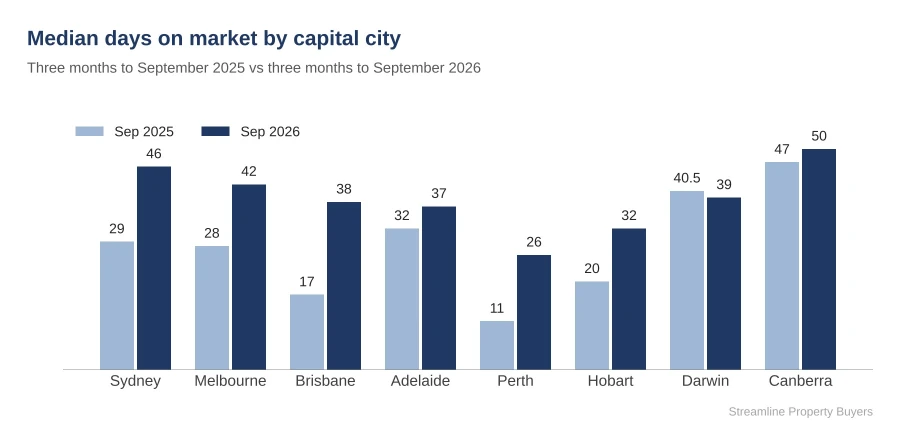
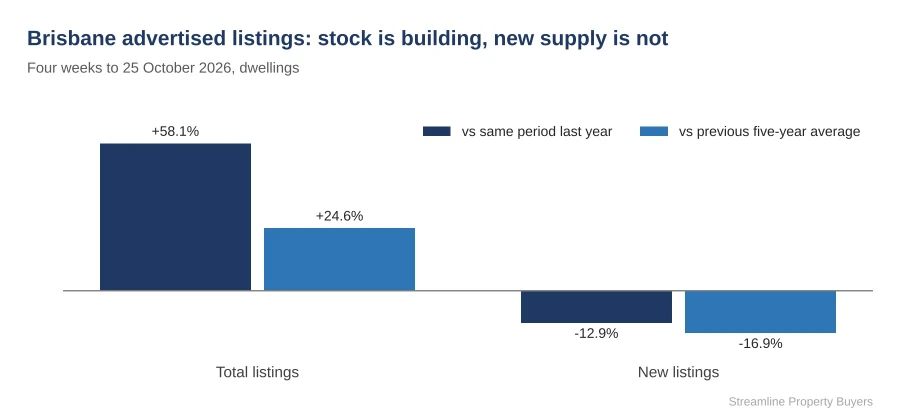
The second thing is demand. Estimated home sales across Brisbane over the past three months were around 29% lower than the same period last year. Median days on market has increased from 17 days a year ago to 38 days, while total listings over the four weeks to 25 October were 58.1% higher than a year ago. Yet new listings were actually 12.9% lower.
Source: Cotality Monthly Housing Chart Pack, October 2026
That tells us something important. Stock is accumulating because property is taking longer to sell, not because Brisbane has suddenly been flooded with new listings. Buyers have more choice, more time and more negotiating power, while sellers are having to be more realistic about where the market is today. In fact, Brisbane’s total listings are now 24.6% above the previous five-year average, despite new listings sitting 16.9% below that average.
Source: Cotality Housing Market Webinar, October 2026 (listings over the four weeks to 25 October 2026).
Higher interest rates are clearly playing a role. The cash rate had already increased by 100 basis points this year to 4.60% ahead of the Reserve Bank’s Melbourne Cup Day meeting, reducing borrowing capacity and affecting confidence. For many buyers, the issue is not that they no longer want to buy. It is that the amount they can borrow has changed, repayments are higher and they are less willing to rush. The Reserve Bank lifted the cash rate by a further 25 basis points on Melbourne Cup Day to 4.85%, and Cotality estimates that this latest increase takes the reduction in borrowing capacity through the current rate-hiking cycle to around 11.5%, or more than $105,000.
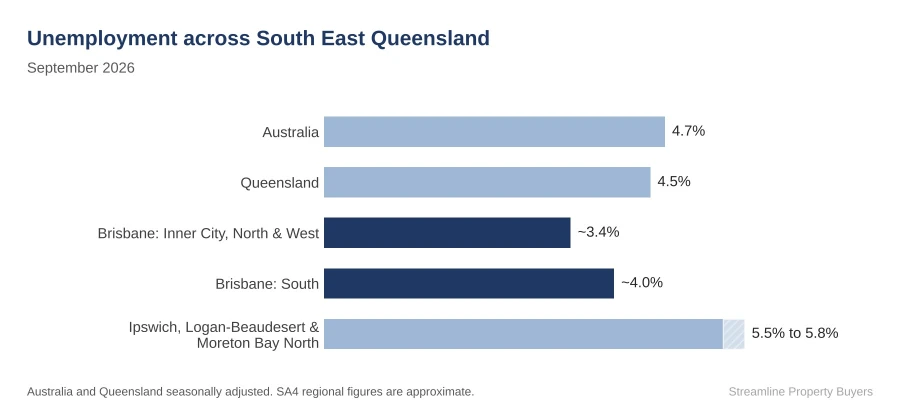
There are still some important positives sitting underneath the short-term data. Queensland’s unemployment rate was 4.5% in September, slightly below the national rate of 4.7%. Within Brisbane, unemployment remains lower again across the inner city, north and west. Brisbane’s economy is also forecast to grow strongly over the longer term, supported by professional services, healthcare, transport and logistics, advanced manufacturing, construction and the visitor economy.
Source: ABS, Labour Force, Australia, September 2026; ABS, Labour Force, Australia, Detailed (SA4 regions).
We have also seen a market like this before. During the second half of 2022, Brisbane house values fell by more than 2% in a single month at the steepest point. By early 2023 values were rising again even while the Reserve Bank was still increasing interest rates. That does not mean history will repeat itself in exactly the same way, but it is a useful reminder that sentiment can change relatively quickly.
Brisbane Dwelling Values
Brisbane dwelling values fell 2.0% in October, following a 1.5% decline in September. Readers comparing this with last month’s update may notice that Cotality has since revised September’s result to a 2.1% fall. Revisions are a normal part of the index methodology, with each month updated as later-settling sales are recorded. Over the rolling quarter values were down 6.1%, compared with a 4.7% quarterly fall reported a month earlier. Annual growth has now slowed to just 0.4%.
Source: Cotality Home Value Index, November 2026 (results to 31 October 2026).
That still compares more favourably on an annual basis with Sydney, down 9.4%, Melbourne, down 7.6%, and Canberra, down 3.7%. Adelaide was up 3.7%, Perth 3.9%, Hobart 5.5% and Darwin 9.7%.
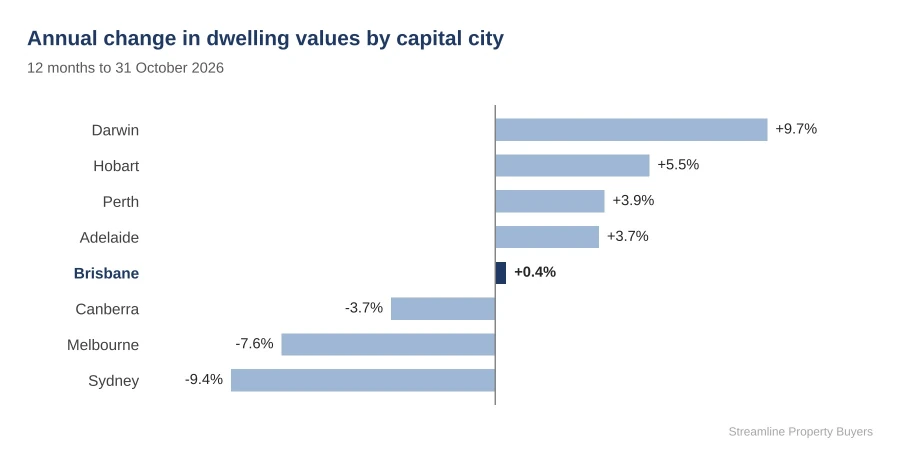
Source: Cotality Home Value Index, November 2026 (results to 31 October 2026).
It is also worth looking at a second data set. PropTrack’s Home Price Index, which measures the same Brisbane market, is reporting a much milder result. PropTrack shows Brisbane dwelling values down 0.4% over the month and 0.2% higher over the year, with a median dwelling value of $1,014,000.
In theory, both indices are tracking the same thing. In practice, they use different methodologies, data inputs and reporting periods, so their monthly results can diverge, particularly when market conditions are shifting quickly. What matters is that both agree on the direction. Brisbane values are falling, annual growth has flattened to close to zero, and the median dwelling value sits at just over $1 million on either measure.
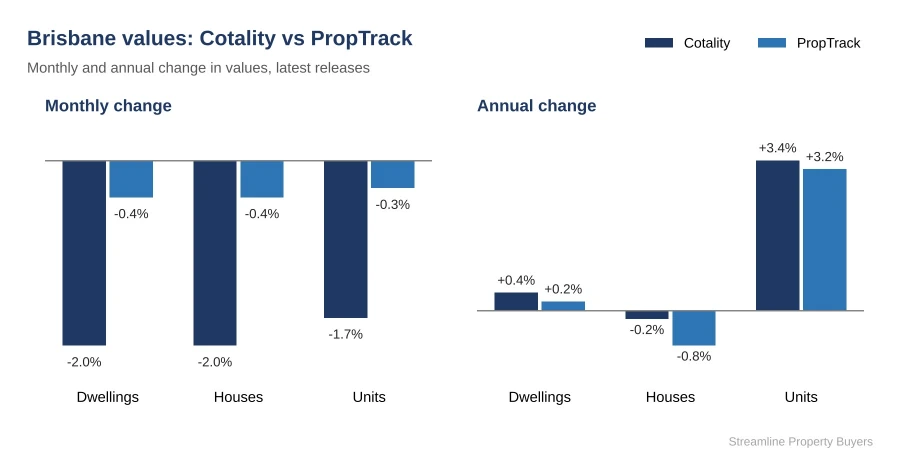
Sources: Cotality Home Value Index, November 2026 (results to 31 October 2026); PropTrack Home Price Index, November 2026.
The market has also become much more uniform across price segments. Over the three months to September, Brisbane’s lower quartile fell 4.3%, the middle 50% fell 5.0% and the upper quartile fell 4.6%. In the previous three-month period those falls were 2.0%, 2.9% and 2.8% respectively. Earlier in the downturn the more affordable end was showing greater resilience, but that gap has now narrowed considerably.
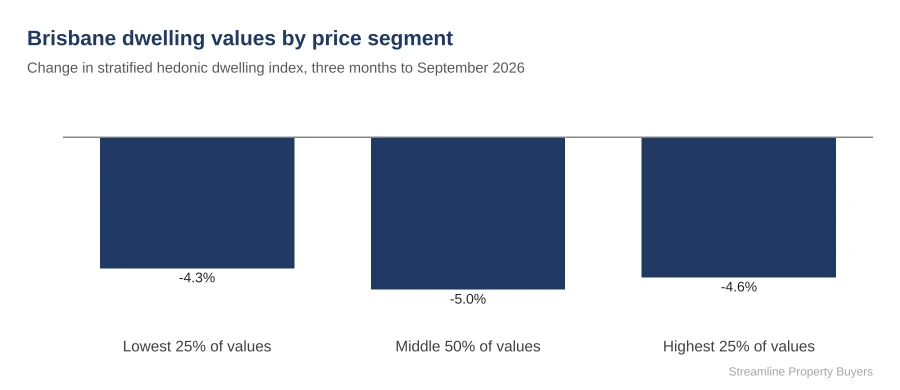
Source: Cotality Monthly Housing Chart Pack, October 2026.
Brisbane House Values
Brisbane house values fell 2.0% in October, taking the median estimated house value to $1,111,530. That is $34,548 lower than the $1,146,078 reported at the end of September.
Over the quarter, house values fell 6.2%, compared with 4.9% in September. On an annual basis, Brisbane houses are now 0.2% lower than a year ago. PropTrack recorded a smaller 0.4% fall in Brisbane house values over the month, with house values 0.8% lower over the year and a median house value of $1,150,000. On both measures, Brisbane houses are slightly lower than a year ago.
Again, the comparison with other capitals is useful. Sydney house values were down 10.8% annually and Melbourne 8.9%, while Adelaide and Perth were both still up around 4%. Brisbane is therefore clearly in a correction, but it is not experiencing the same annual decline as the two largest capital city markets.
Brisbane Unit Values
Units also moved lower in October, falling 1.7% over the month and 5.6% over the rolling quarter. The median estimated unit value is now $811,084, down from $834,627 in September.
Importantly, units are still outperforming houses over the year. Brisbane unit values remain 3.4% higher than 12 months ago, compared with houses at -0.2%. PropTrack tells the same story, with Brisbane units down 0.3% over the month but still 3.2% higher over the year, at a median of $810,000. On either data set, units are outperforming houses.
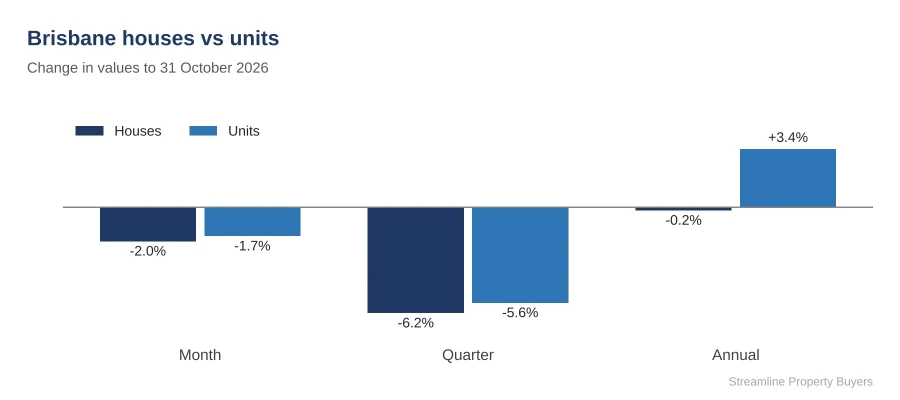
Source: Cotality Home Value Index, November 2026 (results to 31 October 2026).
That relative resilience makes sense. Units generally sit at a lower price point, which matters when borrowing capacity is constrained. There is also still a significant affordability gap between houses and units, so the unit market continues to attract buyers who may no longer be able to stretch to a detached house in their preferred location.
Brisbane’s Rental Market
The rental market remains much tighter than the sales market.
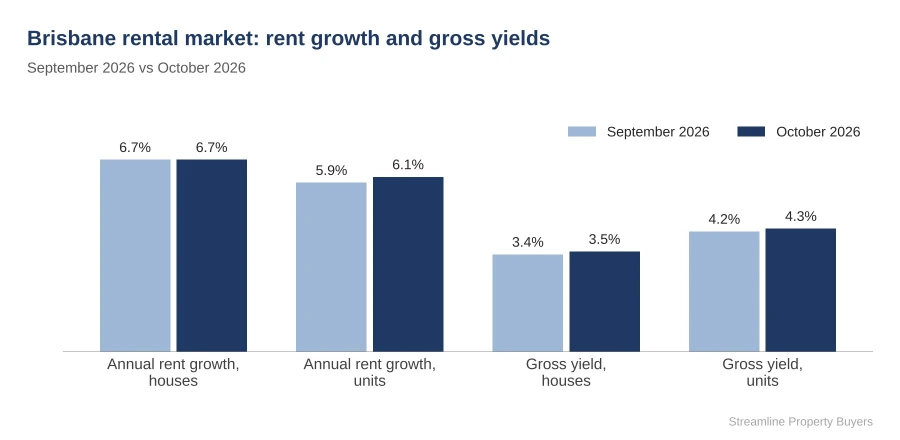
Greater Brisbane’s vacancy rate remained at 0.9% in September according to SQM Research. Cotality shows annual house rent growth holding at 6.7% in October, unchanged from September, while unit rent growth increased slightly from 5.9% to 6.1%.
Gross rental yields have also edged higher as values soften and rents continue to rise. House yields increased from 3.4% in September to 3.5% in October, while unit yields increased from 4.2% to 4.3%.
Source: Cotality Home Value Index, October 2026 and November 2026 editions.
For investors, that does not suddenly make every property cash-flow positive. Interest rates, insurance, maintenance, strata and other holding costs remain high. But it does reinforce the point that rental demand remains very different to buyer demand, and Brisbane’s underlying housing shortage has not disappeared.
Summary
There is no question Brisbane has moved into a softer phase. Values are falling, homes are taking longer to sell and buyers have more choice than they have had for some time. Cotality and PropTrack differ on how sharp the decline has been, but both point in the same direction.
But this is also a much more fragmented market than the median numbers suggest.
We are still seeing scarce, high-quality property attract strong competition, and there have been suburb records broken across Brisbane even during this period of broader decline. Not every property follows the citywide median. Location, land, street quality, flood exposure, renovation quality, scarcity and the depth of the buyer pool still matter enormously.
It is also worth remembering that much of the October data reflects transactions occurring through a period when buyer sentiment was particularly weak. On the ground through October, we have started to see some improvement in engagement. That does not mean values will suddenly turn positive in November, but the rate of decline may begin to moderate if confidence stabilises.
For buyers, this is actually a market worth paying attention to. There is more stock, less urgency and greater scope to negotiate than there was a year ago. That creates opportunity, particularly for buyers who are financially prepared and selective about what they purchase.
The structural shortage of housing in Brisbane has not been solved. Brisbane is projected to add around 470,000 people over the decade to 2034–35, while delivering new housing remains difficult and expensive.
Sentiment will change at some point. When it does, buyer activity can return much faster than many people expect.
For now, the key is not to ignore the weaker data, but to read it in context. Brisbane is correcting after a very large upswing. That is very different from saying the long-term story has disappeared.
We hope that you have found our Brisbane Property Market Update October 2026 helpful.
Connect with us today
To book a FREE discovery call ~ Click Here
