Six kilometres from the Brisbane CBD, Grange sits quietly in Brisbane’s inner north, the kind of suburb that often gets bypassed by buyers heading straight to Wilston or Newmarket. That tends to work in favour of those who do their research or engage buyers agent services. The streets are quiet, the blocks are generous by inner-Brisbane standards, and the suburb has held onto its character housing in a way that many of its neighbours have not. This Grange suburb profile pulls together the real estate data, school and transport facts, and on-the-ground lifestyle detail that anyone seriously considering Grange Brisbane needs before making a move.
Key Takeaways
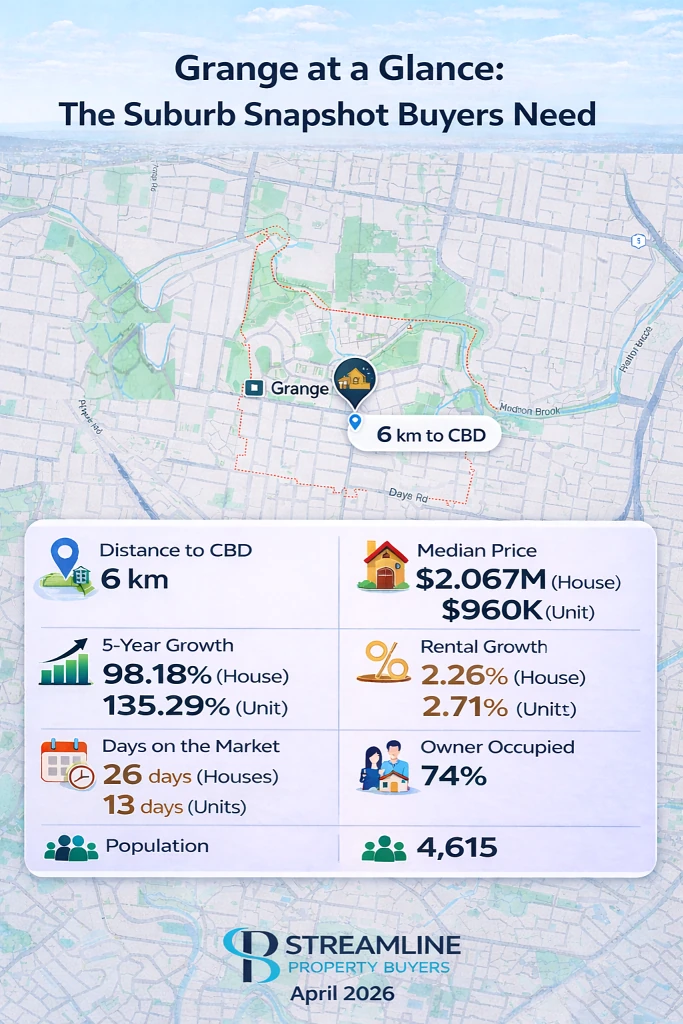
- Location: 6km north of Brisbane CBD.
- Median House Price: $2,067,000; annual house capital growth of 20.00%.
- Median Unit Price: $960,000; annual unit growth of 29.73%.
- Days on Market: Houses averaging 26 days; no data available for units.
- Rental Yields: Houses at 2.26% ($900/week); units at 2.71% ($500/week).
- Demographics: Population 4,615; predominant age group 40 to 49; professional couples and families; median weekly household income $3,655.
- Transport: Bus access to CBD via Lutwyche Road and Days Road; Wilston train station nearby; close to Airport Link and Clem Jones tunnels.
- Schools: Wilston State School, Windsor State School (catchment), St Columba’s Primary, Everton Park State High, Kedron State High.
- Green Space: Kedron Brook corridor and Bikeway, Grange Forest Park, Lanham Park, Emerson Park.
- Investment Snapshot: Median weekly rent $900 for houses; gross rental yield approximately 2.26%; vacancy rate 0.88%; stock on market at 0.66%.
Geography
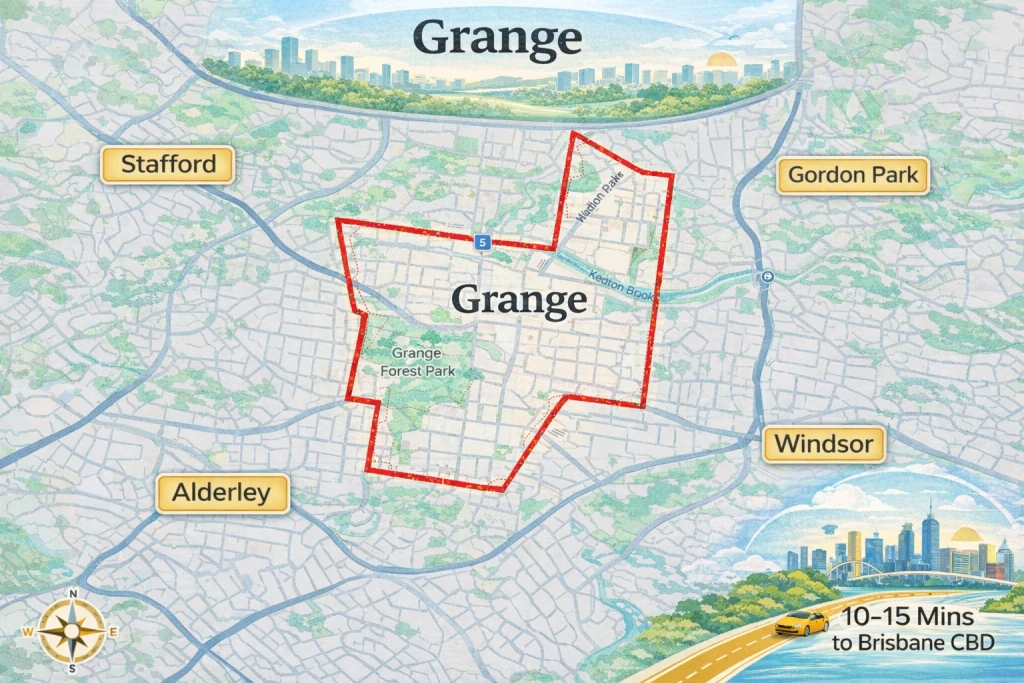
Grange covers approximately 1.75 square kilometres of Brisbane’s inner north. The suburb runs along the southern bank of Kedron Brook, sharing boundaries with Stafford, Gordon Park, Lutwyche, Alderley, Newmarket, Wilston, and Windsor. For such a compact area, it has a lot of neighbours.
The western end of Grange climbs up toward The Pinnacle, a hill that tops out at 57 metres above sea level. That elevation matters more than people expect. It means better airflow, city views from certain spots, and a flood risk profile that’s meaningfully different from properties near the creek.
Kedron Brook runs the full length of the suburb’s northern edge. If the property you’re looking at sits near the water, check the Brisbane City Council flood awareness map for that specific address before going further.
The suburb got its name from the Grange Tannery and Fellmongery Company, which operated along Kedron Brook from the 1860s. Residential subdivision started in 1903. That history explains the character housing stock you still see across the suburb today.
Transport
Most Grange residents drive. Via Lutwyche Road and the Inner City Bypass, the CBD is typically a 10 to 15 minute trip. Wilston train station is a short walk south of the suburb boundary. Buses run along the main arterial roads, connecting to the CBD and surrounding inner suburbs.
The suburb also sits close to both the Airport Link Tunnel and the Clem Jones Tunnel, making airport access and travel north toward the Sunshine Coast relatively convenient. For route and timetable details, visit translink.com.au.
Education
School catchments are a significant factor for families choosing Grange.
Child Care Centres
There are 2 child care and early learning centres located within or directly serving Grange QLD 4051, offering families access to early childhood education close to home:
| Centre / Operator | Address |
| Wilston Grange Kindergarten and Pre School | Sellheim Street, Grange QLD 4051 |
| Wilston Outside School Hours Care | 11 Primrose Street, Grange QLD 4051 |
Schools
The options at primary level are solid, and catchment boundaries are part of why families tend to prefer this suburb over similarly priced neighbours.
| School | Type | Notes |
| Wilston State School | Public | Primary; main catchment for most of Grange |
| Windsor State School | Public | Primary; eastern pocket of Grange |
| St Columba’s Primary | Catholic | Well-regarded local primary |
| Everton Park State High | Public | Main public secondary catchment |
| Kedron State High | Public | South-east Grange catchment |
There are no secondary schools within the suburb itself, so most families travel to nearby high schools. Always verify the catchment for a specific address before purchasing using the Queensland Government’s school catchment tool.
Amenities and Lifestyle
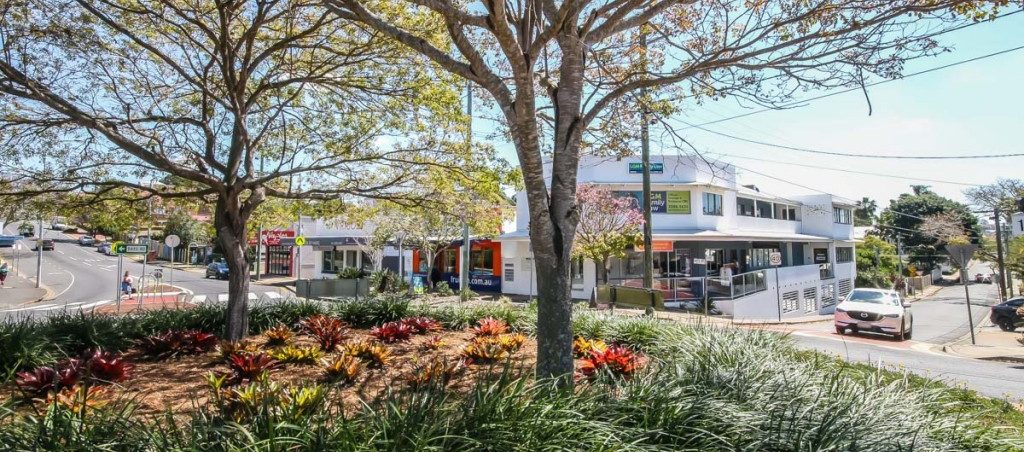
Day-to-day life in Grange is easy. The Kedron Park Road strip covers the basics: cafes, local shops, and services within walking distance for most of the suburb. Residents rate the walkability highly, and from what I see with buyers relocating here, the community feel is one of the things that tends to surprise people once they’re actually living there.
Westfield Chermside is a short drive north and covers everything from major retail to dining to a cinema. Stafford City Shopping Centre on Stafford Road is the closer option for everyday errands. Both are accessible in under 10 minutes by car.
The Royal Brisbane and Women’s Hospital at Herston is also nearby, which is worth knowing if you work in health or allied health.
Green Space
About 24% of Grange is parkland and open space. That’s a higher proportion than most inner suburbs, and you feel it walking around. The Kedron Brook Bikeway traces the northern edge and ties into trail networks heading east and west. Grange Forest Park, Lanham Park, and Emerson Park are all within the suburb, with smaller neighbourhood reserves filling the gaps.
Worth noting for buyers coming from hillier parts of Brisbane: Grange is unusually flat. That makes it a different kind of suburb to move around in day to day.
What Type of Properties Are in Grange?
Most of the housing stock is character Queenslanders, built from the 1920s through to the 1940s on blocks of 400 to 600sqm or more. Timber on stumps, wide verandahs, high ceilings. These are the homes that attract the strongest competition when they come to market, particularly when they’ve been well looked after or thoughtfully renovated.
Post-war brick and weatherboard properties sit mainly in the flatter eastern parts of the suburb. At the other end, you’ll see new high-end builds coming through as buyers pick up older homes on large blocks and start from scratch.
Units don’t feature much in Grange. The suburb has largely avoided the medium-density changes that have reshaped nearby streets in Lutwyche and Gordon Park. For buyers who care about what the neighbourhood looks like in 10 years, that matters.
The most competitive properties are on the elevated western streets near The Pinnacle. Larger blocks, city views from some positions, and brick construction from the 1950s and 60s that tends to hold its value well.
Is Grange a Good Suburb to Invest In?
Grange’s Property Market Performance
Grange’s house market has delivered strong results over both short and long timeframes. The current median house price sits at $2,067,000, with 20.00% annual growth representing a $344,500 increase over twelve months. Over five years, house prices have risen by 98.18% ($1,024,000), reflecting sustained demand in a supply-constrained suburb. The ten-year annual compound growth rate (CAGR) for houses stands at 9.13%, with the five-year CAGR at 14.66%.
The unit market has also performed strongly, with the median unit price reaching $960,000 and annual growth of 29.73% ($220,000). Over five years, unit values have increased by 135.29% ($552,000), with a five-year CAGR of 18.66%.
| Houses | Units | |
| Median Price | $2,067,000 | $960,000 |
| 3 mo. Change | 6.00% (+$117,000) | 22.76% (+$178,000) |
| 12 mo. Change | 20.00% (+$344,500) | 29.73% (+$220,000) |
| 3-Yr Change | 27.59% (+$447,000) | 15.66% (+$130,000) |
| 5-Yr Change | 98.18% (+$1,024,000) | 135.29% (+$552,000) |
| 10-Yr Annual Growth (CAGR) | 9.13% | 8.02% |
| 5-Yr Annual Growth (CAGR) | 14.66% | 18.66% |
| Median Rent (per week) | $900 | $500 |
| Sales Days on Market | 26 days | No data |
| Gross Rental Yield | 2.26% | 2.71% |
Days on Market
Days on Market is a leading indicator of buyer competition. A lower figure means properties are selling quickly, signalling strong demand relative to supply. The benchmark to watch is 90 days; properties sitting longer than this tend to attract buyer hesitancy. Grange houses are comfortably below this threshold at an average of 26 days.
| Days on Market | Houses |
| Current | 26 days |
| 3 mo. Change | +4.00% (+1 day) |
| 12 mo. Change | +8.33% (+2 days) |
| 3-Yr Change | 0.00% (no change) |
| 5-Yr Change | -50.00% (-26 days) |
The five-year improvement in days on market is notable: houses that were taking around 52 days to sell five years ago are now clearing in 26 days. That reflects a meaningful increase in buyer competition and a tightening of the market over time.
Rental Yield
Rental yield is the estimated gross rental return, calculated by dividing annual rent by the median price. Note that yields typically compress as prices rise. A declining yield is not necessarily a negative; it often reflects strong capital growth outpacing rental increases, which is the pattern in Grange.
| Rental Yield | Houses | Units |
| Current | 2.26% | 2.71% |
| 3 mo. Change | -5.44% (-0.13%) | -24.51% (-0.88%) |
| 12 mo. Change | -12.06% (-0.31%) | -17.13% (-0.56%) |
| 3-Yr Change | -6.22% (-0.15%) | +3.04% (+0.08%) |
| 5-Yr Change | -30.25% (-0.98%) | -30.33% (-1.18%) |
House yields at 2.26% reflect the high entry price point and strong capital growth over time. Median house rent has increased by 38.46% over five years to $900 per week, indicating that rental demand is keeping pace with the broader property market. Unit yields at 2.71% remain broadly consistent with the premium inner-Brisbane market profile.
Buyers primarily seeking yield will likely find better options elsewhere in Brisbane. However, for those focused on long-term capital growth in a compact, supply-constrained suburb close to the CBD, Grange has a track record worth considering.
Key Investment Signals at a Glance
- Houses selling in 26 days signals strong buyer competition well below the 90-day caution threshold.
- Vacancy rate of 0.88%, well below the 2% threshold, indicating tight rental demand.
- Stock on Market (SOM%) at just 0.66%, significantly below the 2% caution level.
- Owner-occupier rate of 74%, high for a suburb this close to the CBD.
- Median weekly household income of $3,655, well above Brisbane’s average.
- At 1.75 km² with no meaningful development land remaining, the suburb cannot absorb new supply the way outer suburbs can, a structural support for prices over time.
- Online buyer demand remains high, with an average of 1,970 potential buyers per suburb per month as at April 2026.
When those numbers are set alongside southeast Queensland’s continued population growth and inner Brisbane’s hard limit on new land supply, the medium-to-long-term case for real estate in Grange holds up well based on current data.
Demographics
Grange’s population was 4,615 at the 2021 Census, up from 4,318 in 2016. The suburb spans 1.75 km² and sits 6 km from the Brisbane CBD. The 40 to 49 age group is the largest, and most households are couples with children. The median weekly household income sits at $3,655, well above Brisbane’s average, with a workforce profile dominated by professionals (39%), managers (20%), and clerical and administrative workers (13%).
Owner-occupation reached 74% in both 2016 and 2021. With 74% of homes owner-occupied, this is a suburb where most buyers intend to stay. The renter proportion has declined steadily from 33% in 2006 to 26% in 2021, a trend that reflects the suburb’s shift toward a firmly owner-occupier character. The crime score sits at a low 10 out of 100, confirming Grange as one of Brisbane’s safer inner suburbs.
Key Demographics Over Time
| 2006 | 2011 | 2016 | 2021 | |
| Population | 4,044 | 4,163 | 4,318 | 4,615 |
| Median Weekly Household Income | $1,523 | $2,097 | $2,445 | $3,278 |
| Median Monthly Mortgage Repayments | $1,697 | $2,375 | $2,300 | $2,600 |
| % Owner Occupier | 67% | 71% | 74% | 74% |
| % Renter | 33% | 29% | 26% | 26% |
| Total Dwellings | 1,633 | 1,637 | 1,636 | 1,677 |
| Avg. People per Household | 2.6 | 2.7 | 2.8 | 2.9 |
Buying Considerations for Grange
A few things worth checking before you get too far down the path on any Grange property:
- Flood overlay: Run the specific address through the Brisbane City Council flood awareness map, especially anything near Kedron Brook.
- Elevation: The western section and the eastern flats are genuinely different. Where the property sits affects flood risk, outlook, and what you’ll pay.
- Heritage and character overlay: A lot of Queenslanders in Grange are covered by heritage or character residential overlays under the Brisbane City Plan. That affects what you can do with the home, so check it before assuming anything.
- School catchment: Confirm the specific address through the Queensland Government school catchment tool before committing.
- Traffic noise: Lutwyche Road and Days Road carry real traffic. Properties sitting directly on those corridors are a different buy from streets set back 200 metres.
- Block size and slope: The elevated western blocks can have significant slope, which adds cost to any extension or rebuild.
- Future development: Check Brisbane City Plan overlays for adjoining properties, particularly anything zoned for medium density
How Streamline Property Buyers Can Help With Your Grange Purchase
At this price point, the gap between buying well and buying average is significant. In Grange, it comes down to the specific street, the block’s position relative to the hill, and the overlay status of the property. Those aren’t things you can read off a listing.
Streamline Property Buyers works exclusively for buyers. We find both on-market and off-market opportunities in Grange Brisbane, including commercial property options, handle negotiation, and do the due diligence that keeps your decision on solid ground. If you’re weighing up a house for sale in Grange, or want to understand whether this suburb fits your goals, get in touch and our team will work through it with you.
Grange QLD 4051 | Data as at April 2026
Property data sourced from SuburbsFinder Ltd (ABN 34 687 487 921) on behalf of PropTrack Pty Ltd (ABN 43 127 386 298), April 2026. Demographics data from the Australian Bureau of Statistics, 2021 Census. This profile is provided for general information purposes only and does not constitute financial, investment, or legal advice. Past performance is not indicative of future results. Users should conduct their own independent due diligence before making property decisions.
Connect with us today
To book a FREE discovery call ~ Click Here
Follow us on LinkedIn | YouTube | Instagram | TikTok
Tune into our podcast ~ Brisbane Property Podcast
