
By Melinda Jennison
Introduction
Brisbane’s property market weakened further through August 2026, confirming that the slowdown which emerged after the May Federal Budget has become a broader and more established downturn. Cotality recorded a 1.0% fall in Brisbane dwelling values over the month, following the 0.6% decline in July. Values now sit 2.7% below the May peak, although they remain 2.8% higher since the start of 2026 and 10.8% higher than a year ago. This is a market that has clearly lost momentum, but not one experiencing a deep correction.
Brisbane is also part of a national slowdown. Sydney recorded the largest monthly fall in August at 1.4%, followed by Melbourne and Canberra at 1.1% each, with Brisbane down 1.0%. Adelaide and Perth each fell 0.8%, Hobart declined 0.2%, and Darwin was the only capital to record growth, rising 0.6%. Over the quarter Brisbane is down 2.7%, a shallower decline than Sydney (-4.7%), Melbourne (-3.9%), Perth (-3.2%) and Canberra (-2.8%). On an annual basis Brisbane remains one of the stronger capitals, up 10.8% and trailing only Perth (15.6%) and Darwin (14.6%), ahead of Adelaide (8.6%), Hobart (8.1%) and the negative annual results now recorded in Sydney and Melbourne.
The more important change is happening in buyer behaviour. The Australian Property Investor Q2 2026 Property Sentiment Report found that only 24% of respondents were positive about the property market, while 48% were negative. Government policy or legislative change was the leading factor stopping people from purchasing an investment property, nominated by 28% of respondents. Queensland still ranked first for perceived investment prospects over the next twelve months, selected by 35% of respondents, yet only 17% of purchases over the prior three months occurred in Queensland. That disconnect is consistent with what we are seeing on the ground in Brisbane. Investors may still like the long-term story, but many are not buying established property right now.
Tenanted properties are consequently taking much longer to sell, because one of their natural buyer groups has stepped away following the Budget changes. First home buyers have also been surprisingly inactive, particularly at the affordable end of the market. This is the cohort the Budget was intended to assist, yet many remain nervous about values falling further and are choosing to wait.
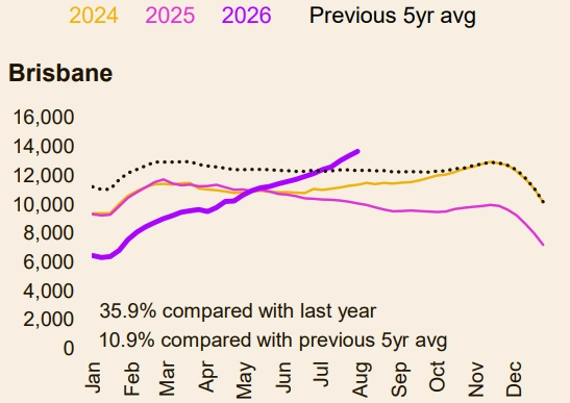
That hesitation is showing up in supply and selling conditions. SQM Research recorded an 18% monthly increase in total Brisbane listings between June and July, the largest increase of any capital city. August figures show total listings have been somewhat stable since the July jump. Cotality’s data tells the same story with total listings for the three months to July being 39.5% higher than a year earlier, while median days on market had lengthened to 28 days, compared with 19 days a year earlier. Cotality also reports sales volumes well below both year-ago and five-year-average levels, with Brisbane transaction activity more than 20% below the same period last year. Auction clearance rates have softened substantially through winter and remain well below longer-term norms.
Source: Cotality
This build-up in listings is not the result of a flood of new stock. New listings were still below their five-year average in early August, which means properties are accumulating because they are taking longer to sell, not because more are coming to market. In practical terms, buyers now have more choice, less urgency and more negotiating power, while sellers need to be increasingly realistic about price.
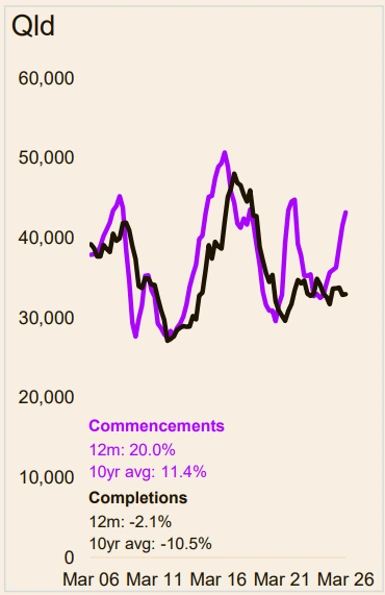
Longer-term supply remains constrained in a different way. Queensland dwelling commencements are up 20.0% over the latest twelve months, while completions are down 2.1%. That gap is a reminder that approvals and starts do not translate immediately into completed homes, and the supply response Brisbane needs will take time to arrive.
Source: Cotality
Brisbane Dwelling Values
Cotality places Brisbane’s median dwelling value at $1,080,142 at the end of August, down from $1,104,094 in July. Dwelling values fell 1.0% over the month and 2.7% over the quarter. Annual growth has moderated sharply to 10.8%, from 14.8% a month earlier.
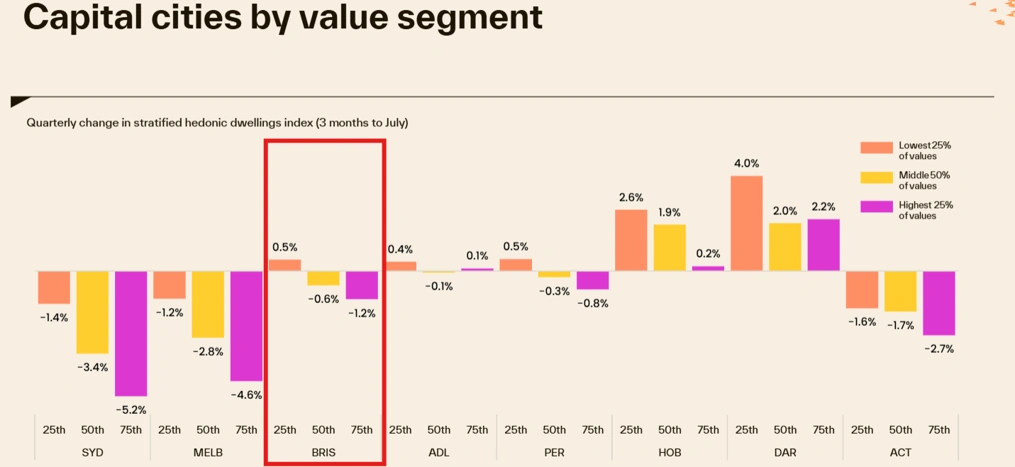
The market segmentation data shows weakness has now spread through all value segments. For the three months to July, Brisbane’s lower quartile was still up 0.5%, while the middle of the market fell 0.6% and the upper quartile fell 1.2%. In the previous update those segments were up 2.6%, 1.6% and 0.4%. The upper end remains weakest, but the important change is that more affordable property is no longer immune from the slowdown.
Source: Cotality
PropTrack reported a similar direction, with Brisbane dwelling prices falling 0.3% over August.
Brisbane House Values
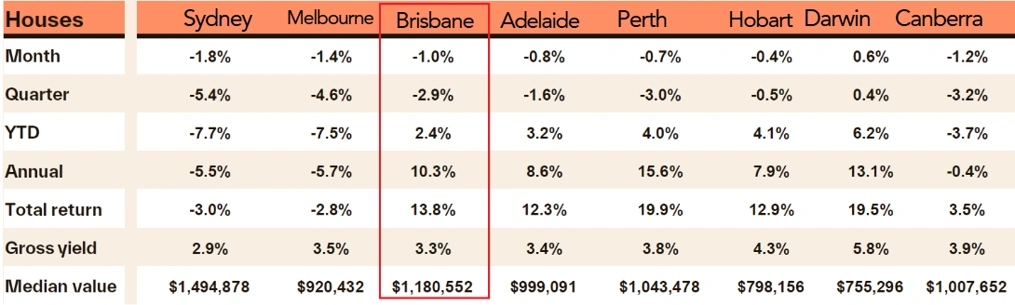
Brisbane house values fell 1.0% in August, taking the median estimated house value to $1,180,552, $26,487 lower than in July. Quarterly house values are now down 2.9%, compared with a 0.9% decline in the July reading, while annual growth has slowed from 14.3% to 10.3%. PropTrack also recorded a 0.3% fall in Brisbane house prices through August.
Source: Cotality
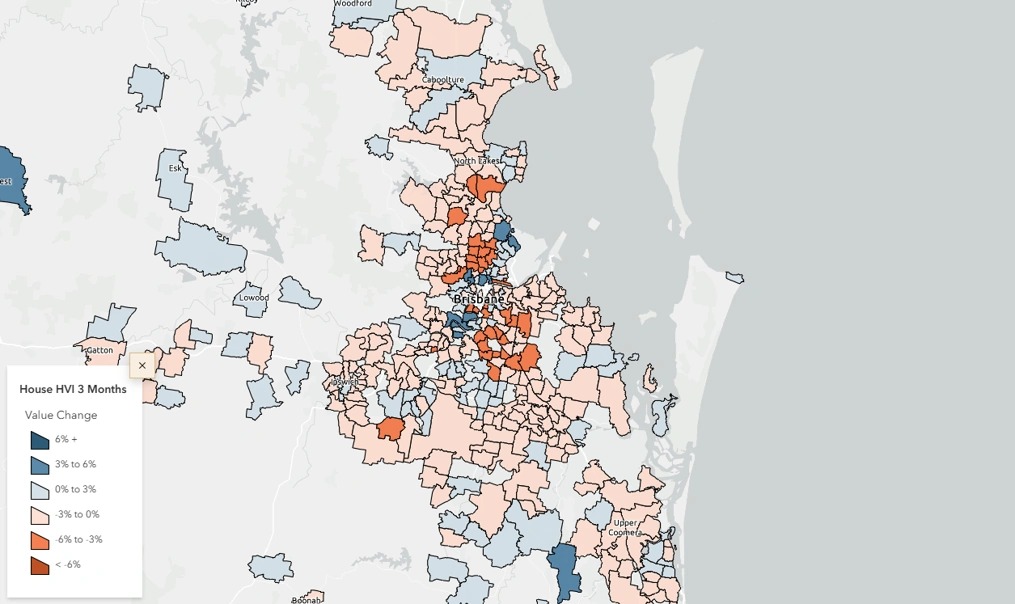
Importantly, the downturn is not uniform across the city. The three-month house value map shows pockets of inner Brisbane still recording growth above 6% over the quarter, while some nearby middle ring locations are showing declines in the 3% to 6% range. This is precisely why city-wide medians need to be interpreted carefully and why suburb level analysis matters more now than it has for years.
Source: Cotality
Brisbane Unit Values
The unit market also lost momentum more noti