
September Quarter 2026
By Melinda Jennison, Managing Director, Streamline Property Buyers
The Quarter at a Glance
| Brisbane snapshot | End of June 2026 | End of Sept 2026 |
| Median dwelling value | $1,118,306 | $1,048,880 |
| Median house value | $1,225,350 | $1,146,078 |
| Median unit value | $885,132 | $834,627 |
| Annual dwelling growth | 17.4% | 5.9% |
| Median days on market | 20 days | 35 days |
| Cash rate | 4.35% | 4.60% |
| Gross yield, houses / units | 3.1% / 3.9% | 3.4% / 4.2% |
| Annual rent growth, houses / units | 6.6% / 5.8% | 6.7% / 5.9% |
Source: Cotality; cash rate, Reserve Bank of Australia. June figures as first reported.
Introduction
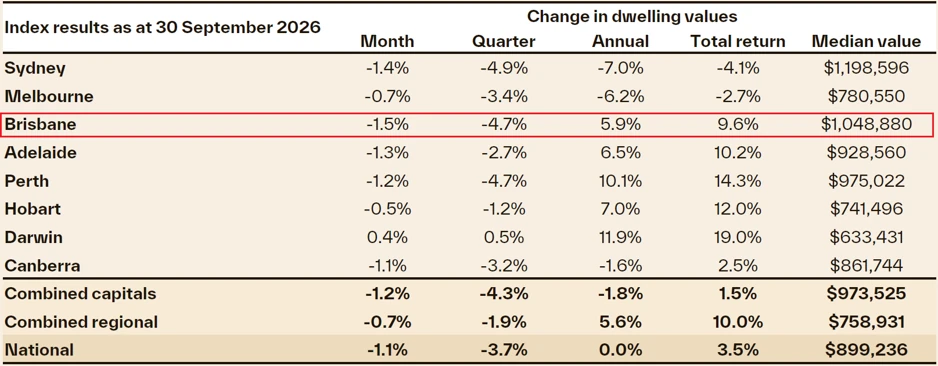
The September quarter of 2026 will likely be remembered as the period in which Brisbane’s post-Budget slowdown became a clear and measurable decline. Cotality’s Home Value Index recorded dwelling value falls in every month of the quarter, and each was larger than the last: 0.6% in July, 1.0% in August and 1.5% in September. The September result was the largest monthly decline of any capital city.
By the end of the quarter, Brisbane dwelling values were 4.7% lower over three months and 5.4% below their May peak. Annual growth, which stood at 17.4% at the end of June, slowed to 5.9%, and values are now just 0.1% higher than at the start of 2026.
Those numbers deserve context, and this report aims to provide it. Brisbane has moved from exceptionally strong growth to a broadly flat year, rather than unwinding the gains of the previous cycle. Over the decade to July, Brisbane dwelling values rose 116.6%, the strongest growth of any capital city. Cotality’s Pain and Gain Report found that 99.8% of Brisbane resales in the June quarter made a nominal profit, with a median gain of $525,000 after a median hold period of 8.2 years. That is a measure of wealth created through the last cycle, not of where values are heading now.
Brisbane’s own recent history also offers a valuable reference point. The interest rate cycle of 2022 and 2023 produced sharper monthly falls in house values than anything recorded this quarter, followed by a strong recovery once sentiment stabilised. We explore that comparison in detail below, alongside Cotality’s latest suburb level mapping, which shows how differently the decline is playing out across the city.
Putting This Quarter in Context: Lessons from 2022
It is easy to read a run of monthly declines in isolation. The chart below tracks Cotality’s monthly change in Brisbane house and unit values from January 2020 to September 2026, and it shows that the current downturn, while real, is not unprecedented.
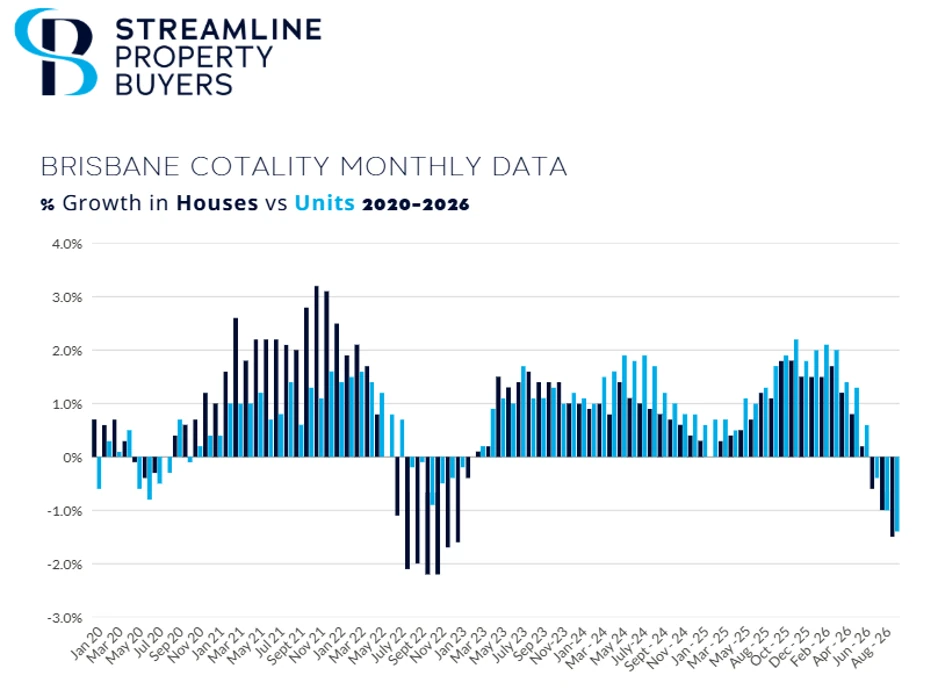
Monthly change in Brisbane house and unit values, 2020 to 2026. Source: Cotality
In May 2022, the Reserve Bank began lifting the cash rate from its record low of 0.10%, a setting introduced during the COVID-19 pandemic. Over the following eighteen months it rose to 4.35%, an increase of 4.25 percentage points across thirteen moves. Brisbane house values responded quickly. Through the second half of 2022, monthly declines were consistently steeper than those we are seeing today, with house values falling by more than 2% in a single month at the steepest point. By comparison, house values fell 0.6% in July, 1.0% in August and 1.5% in September this year.
What happened next is the more important lesson. The underlying fundamentals of the Brisbane market had not changed. Population growth remained strong, housing supply remained constrained and employment held up. The decline was driven largely by a sharp shift in sentiment, as buyers adjusted to rising rates after years of historically cheap money. Once that initial shock was absorbed, values recovered. Monthly growth returned in early 2023, while the Reserve Bank was still raising rates, and Brisbane went on to record several years of strong growth.
That episode shows how powerfully sentiment can move property values in the short term, and how quickly a market can respond once confidence returns, provided the fundamentals remain intact. This year, the cash rate has risen by one percentage point across four increases, a much smaller adjustment than in 2022 and 2023, although many buyers are now borrowing larger amounts after several years of price growth.
The comparison is strongest for houses. Units were far more resilient in 2022, with monthly falls generally below 1%. September’s 1.4% decline in unit values is sharper than any monthly unit result in that period, reflecting the strong growth units have recorded over the past two years and the retreat of investors, who make up a larger share of unit buyers. Units warrant closer attention in the months ahead.
None of this means values cannot fall further. It means the current decline should be read in context. If the fundamentals hold, Brisbane’s most recent experience suggests the recovery can begin sooner, and move faster, than many people expect.
Demand Under Pressure
Buyer demand weakened on several fronts at once. The cash rate entered the quarter at 4.35% following three increases earlier in 2026, and a further 25 basis point rise at the end of September lifted it to 4.60%, its highest level since November 2011. Each increase reduces borrowing capacity, and markets are pricing in the possibility of further tightening.
Consumer confidence has remained deeply pessimistic. The Westpac-Melbourne Institute Consumer Sentiment Index recovered through July and August before falling 5.2% in September to 84.4 points, 11.6% lower than a year earlier.
Policy change has reshaped investor behaviour. The negative gearing changes announced in the May Federal Budget, combined with higher holding, compliance and land tax costs, have pushed many investors to the sidelines. The Australian Property Investor Q2 2026 Property Sentiment Report found that government policy or legislative change was the leading barrier to buying an investment property, nominated by 28% of respondents. Queensland still ranked first for investment prospects, selected by 35% of respondents, yet only 17% of recent purchases occurred in the state. The PIPA Annual Investor Sentiment Survey found that 23.7% of Brisbane respondents sold at least one investment property over the year, up from 19.7% the year before.
In practical terms, tenanted properties are taking considerably longer to sell because one of their natural buyer groups has stepped back. First home buyers, the cohort the Budget was designed to assist, have also been more hesitant than expected, with many waiting to see whether values fall further.
Supply and Selling Conditions
Sellers have been slower to adjust than buyers, and the result is a substantial build-up of stock. Total listings were 23.2% higher than a year earlier in July, 39.5% higher across the three months to July, and 53.3% higher by September.
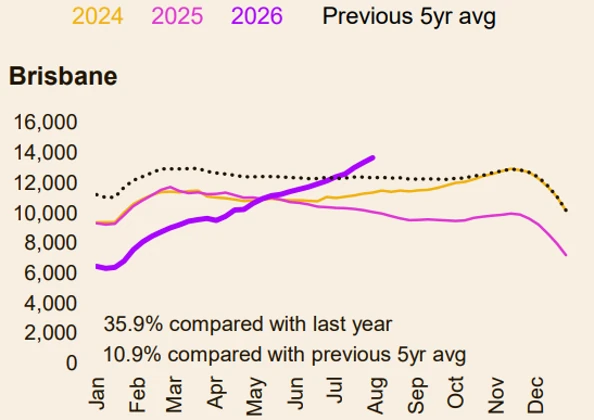
Total listing volumes in Brisbane. Source: Cotality
The critical detail is that this is not a flood of new stock. New listings were only 5.4% higher than a year ago in September and sat below their five-year average through much of the quarter. Listings are accumulating because properties are taking longer to sell, and some vendors are withdrawing when the market will not meet their price. This reflects a gap between buyer and seller expectations rather than a wave of distressed selling.
Selling times confirm the shift. Brisbane’s median days on market rose steadily through the quarter to 35 days in Cotality’s latest figures, compared with 19 days a year earlier. Most capitals recorded longer selling times than a year ago, but Brisbane’s increase of 16 days was the largest of any capital city.
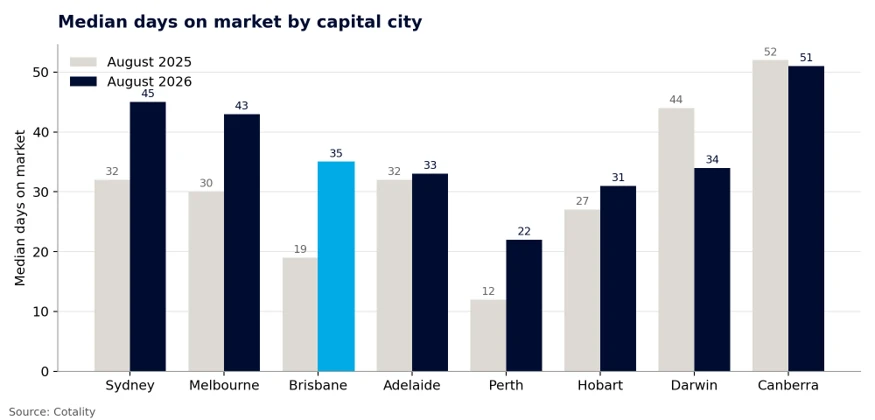
Median days on market, August 2025 and August 2026. Source: Cotality
Transaction volumes have fallen sharply. Sales over the latest three months were 27.2% below the same period last year, the largest annual fall in sales activity among the capitals, while Brisbane’s four-week auction clearance rate fell to 32.8% at the end of August, the lowest of any capital. Over the twelve months to August, Brisbane sales volumes were 8.0% lower, compared with a 5.2% fall across the combined capitals and a 1.8% rise across regional markets. The steeper three-month figure shows how quickly activity has slowed in recent months.
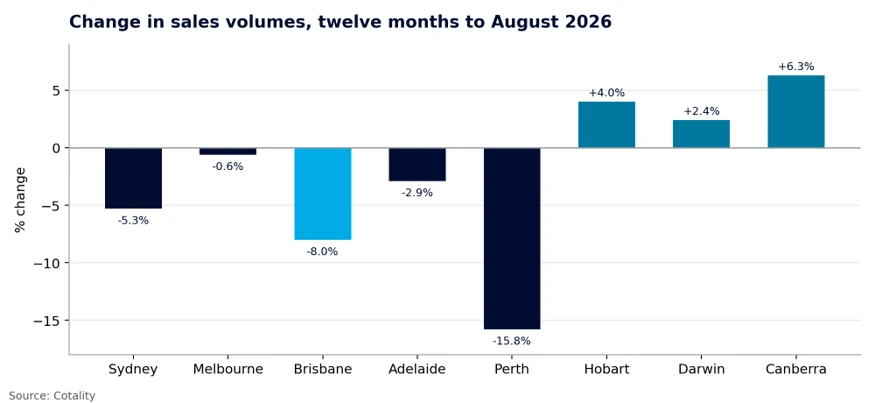
Change in sales volumes, twelve months to August 2026. Source: Cotality
For buyers, the outcome is more choice, less urgency and stronger negotiating power. For sellers, realistic pricing and property quality now matter more than they have for several years.
Brisbane Dwelling Values
Cotality’s median Brisbane dwelling value fell from $1,118,306 at the end of June to $1,048,880 at the end of September, a reduction of $69,426. Cotality revises recent months as additional sales settle, which is why the 4.7% quarterly decline exceeds the three monthly results as first reported.
Source: Cotality
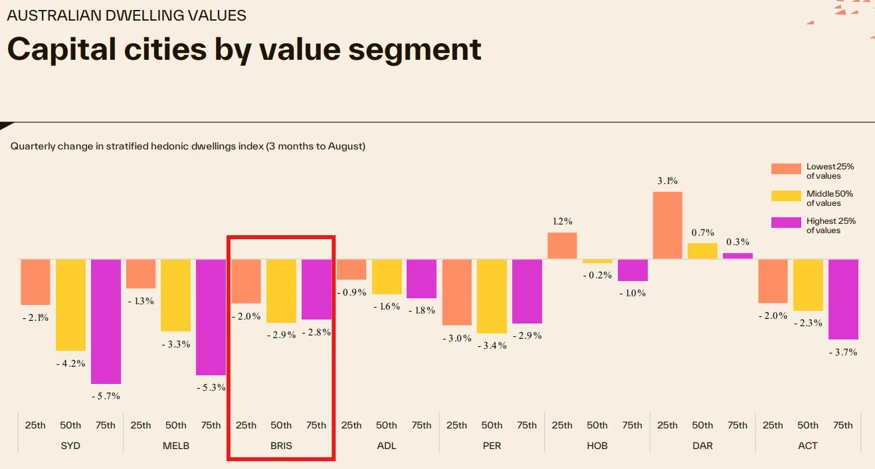
The value segment data shows how the slowdown spread through the market over the quarter. In the three months to June, every segment was still growing: the lower quartile by 2.6%, the middle 50% by 1.6% and the upper quartile by 0.4%. By the three months to August, all three were falling, with the lower quartile down 2.0%, the middle 50% down 2.9% and the upper quartile down 2.8%.
The national comparison is revealing. In Sydney and Melbourne, the most expensive quarter of the market fell more than twice as fast as the most affordable, down 5.7% and 5.3% respectively. In Brisbane, the declines were spread far more evenly across all three segments. That suggests Brisbane’s slowdown reflects a broad reset in buyer capacity and confidence, rather than weakness concentrated at the top end.
Source: Cotality
How Brisbane Compares
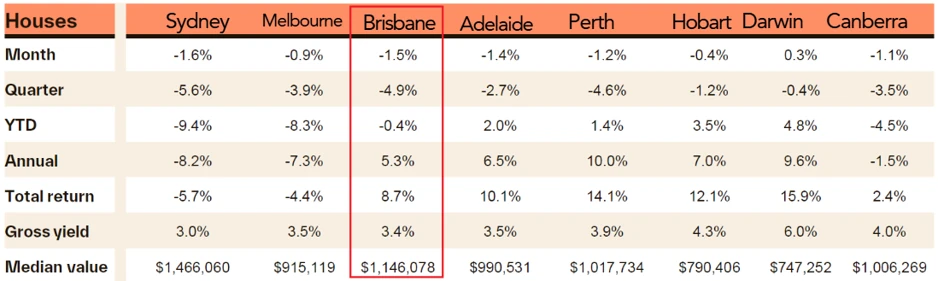
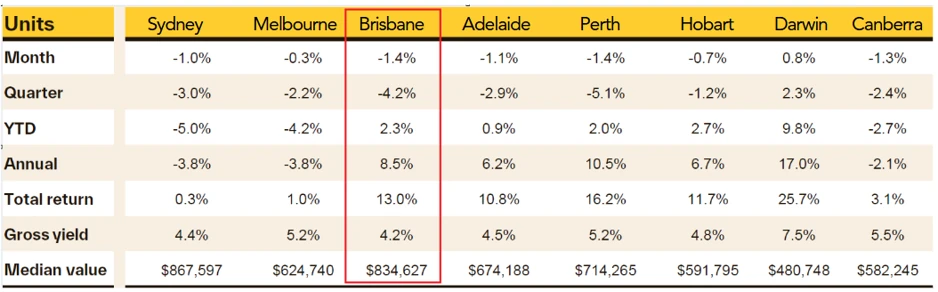
Brisbane was part of a broader national slowdown this quarter. House values fell in every capital city, with Brisbane recording the second largest quarterly decline at 4.9%, behind Sydney at 5.6%. For units, Brisbane recorded a 4.2% decline, second only to Perth at 5.1%. Darwin was the only capital where unit values rose.
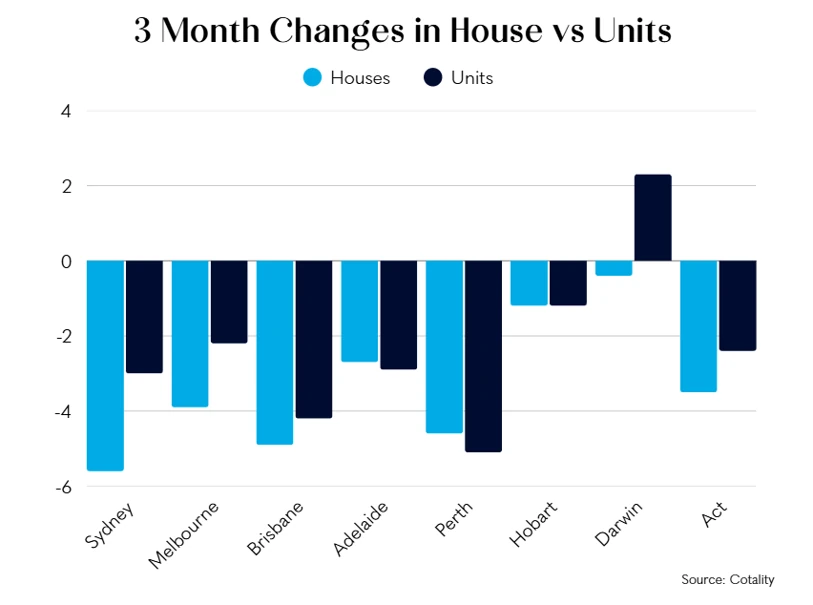
Three-month change in house and unit values by capital city. Source: Cotality
Over twelve months, the picture is more favourable. Brisbane houses remain 5.3% higher than a year ago and units 8.5% higher, while Sydney and Melbourne houses have fallen 8.2% and 7.3% respectively. Brisbane units recorded the third strongest annual result of any capital, behind Darwin and Perth.
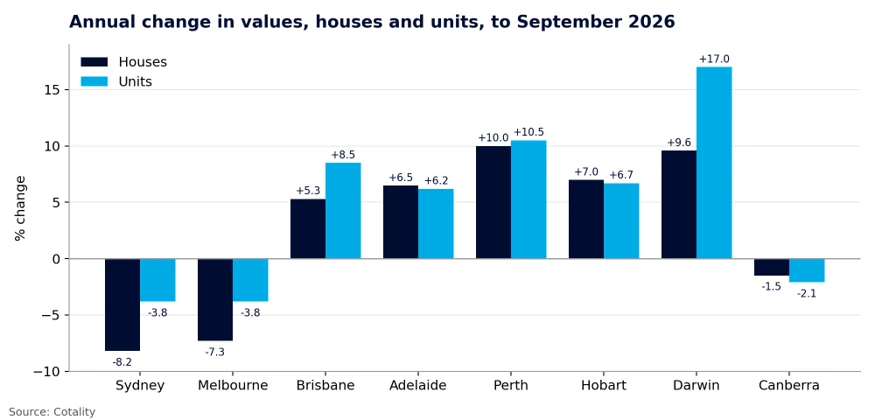
Annual change in house and unit values by capital city. Source: Cotality
Brisbane House Values
Brisbane house values fell 4.9% over the quarter, taking the median from $1,225,350 at the end of June to $1,146,078 at the end of September, a reduction of $79,272, while annual growth slowed from 16.8% to 5.3%. House values are now 0.4% lower than at the start of 2026, although the total annual return, which combines capital growth and rental income, remains 8.7%.
Source: Cotality
House values at a suburb level
Cotality’s suburb level mapping for the quarter shows the slowdown is now widespread, but far from uniform. Across inner Brisbane, many suburbs close to the CBD and the river recorded relatively mild falls of less than 3%, including Ashgrove, Indooroopilly and Morningside, and a small number held steady or recorded modest growth. Most of the middle and outer ring fell by between 3% and 6%. The steepest declines, greater than 6%, were concentrated in pockets of the northern and south-eastern suburbs, including Nundah, Carindale and Mount Gravatt, along with parts of the western suburbs and Salisbury.
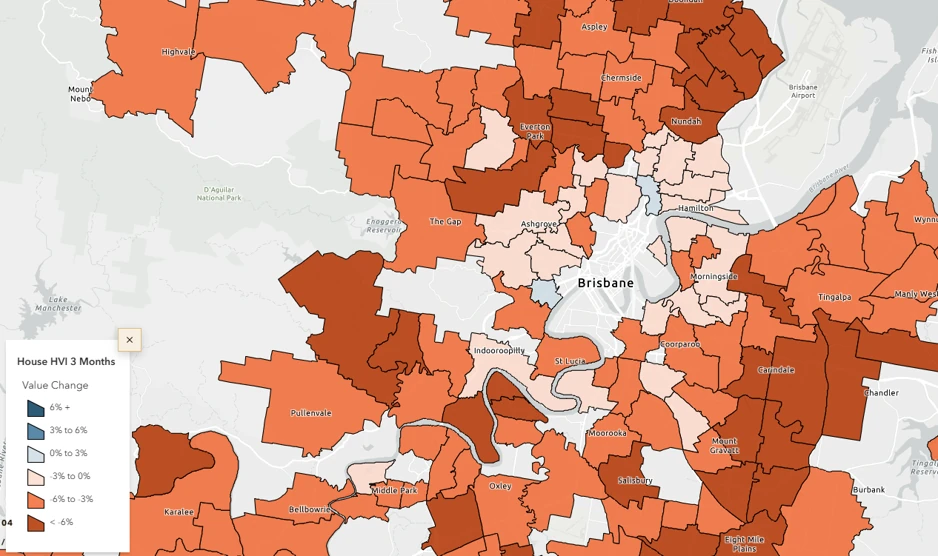
Change in house values, three months to September 2026, Brisbane. Source: Cotality
One likely explanation is the profile of buyers in each area. Inner-city markets tend to be supported by owner-occupiers with greater equity and less reliance on borrowing, while middle ring suburbs that attracted strong demand during the last growth phase are more sensitive to changes in borrowing capacity.
Across South East Queensland, the picture is similar. Falls were recorded across most of Greater Brisbane, Moreton Bay, Logan and the Gold Coast, while regional areas to the west, around Toowoomba and the Lockyer Valley, were generally steadier.
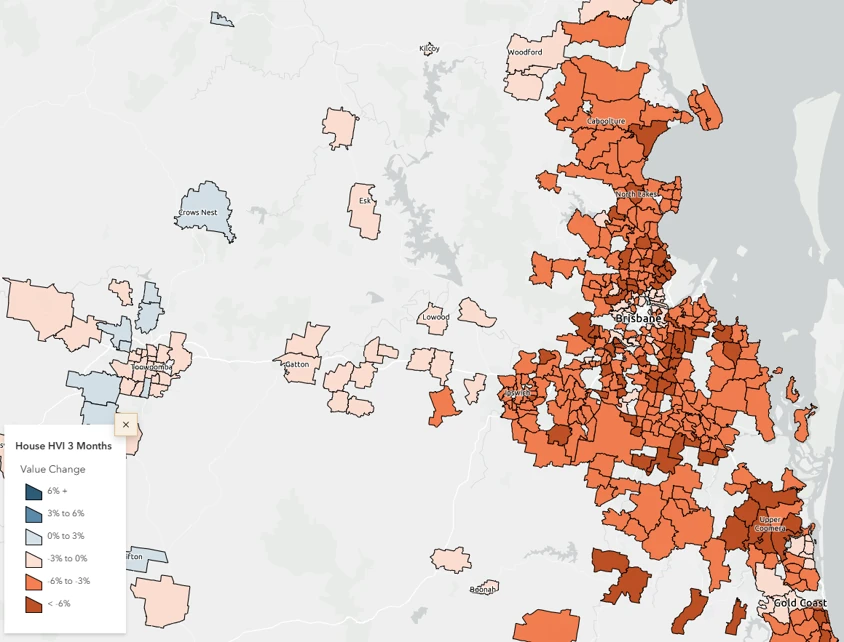
Change in house values, three months to September 2026, South East Queensland. Source: Cotality
Over twelve months, however, the map remains predominantly blue. Most suburbs across Greater Brisbane and South East Queensland are still higher than a year ago, many by more than 6%, with small annual declines limited largely to some inner-city areas. The quarter has taken the edge off a strong year rather than reversing it.
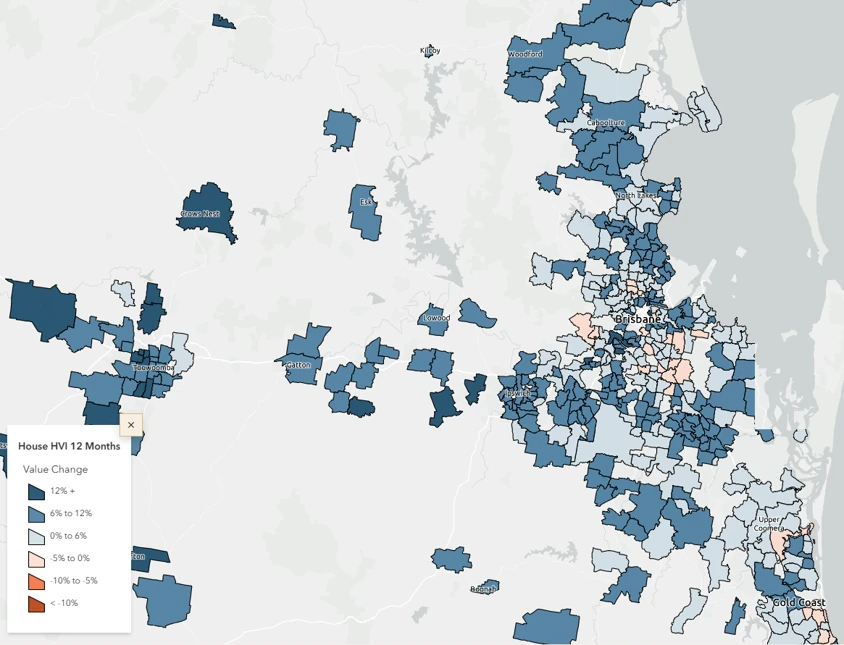
Change in house values, twelve months to September 2026, South East Queensland. Source: Cotality
Brisbane Unit Values
Units have held up better than houses on an annual basis, although they also weakened through the quarter. The median unit value fell from $885,132 to $834,627, a reduction of $50,505, and values were 4.2% lower over the quarter. Annual growth slowed from 20.3% at the end of June to 8.5%, still the strongest of any Brisbane dwelling type, and the total annual return remains 13.0%. Affordability-driven demand supported units early in the quarter, but weaker confidence and the retreat of investors, traditionally an important source of demand in this segment, are now weighing on the market.
Source: Cotality
Unit values at a suburb level
Unit values weakened more consistently across the city. Cotality’s unit map uses narrower ranges than the house map, with the darkest shade representing falls greater than 4%. On that basis, falls of more than 4% were recorded across a broad band of western and northern suburbs, including The Gap, Ashgrove and Chermside, as well as in Carindale, Moorooka, Acacia Ridge and Rochedale South. Many inner-city and bayside unit markets, including Morningside, Tingalpa and Wynnum, fell by between 2% and 4%.
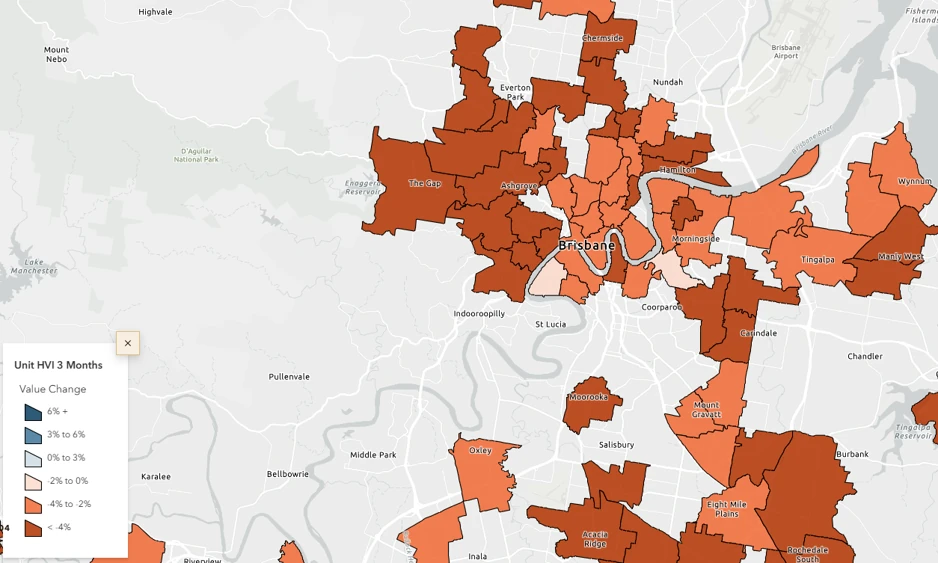
Change in unit values, three months to September 2026, Brisbane. Source: Cotality
Across South East Queensland, unit declines were concentrated in Brisbane and the northern Gold Coast, with smaller unit markets further afield recording more varied results.
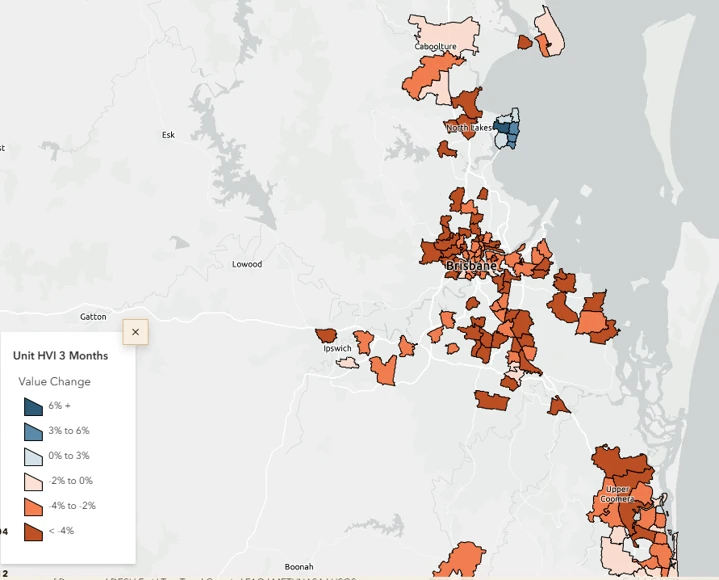
Change in unit values, three months to September 2026, South East Queensland. Source: Cotality
Houses Versus Units
The gap between Brisbane’s median house and unit values now stands at $311,451. Units remain the stronger performer over twelve months, up 8.5% compared with 5.3% for houses, a margin of 3.2 percentage points. Units are also still 2.3% higher for the year to date, while houses are 0.4% lower than at the start of 2026.
Over the most recent quarter, however, that difference has narrowed. Houses fell 4.9% and units 4.2%, and in September the monthly declines were almost identical at 1.5% and 1.4%. As discussed above, that is a notable change from the 2022 downturn, when units held their value far better than houses.
Brisbane’s Rental Market
The rental market continues to tell a very different story to the sales market. Cotality data shows annual house rent growth held at 6.7% through the quarter, while unit rent growth moved from 6.2% in July to 5.6% in August before strengthening to 5.9% in September. Both remain ahead of inflation, and vacancy conditions across Greater Brisbane stayed exceptionally tight throughout the quarter.
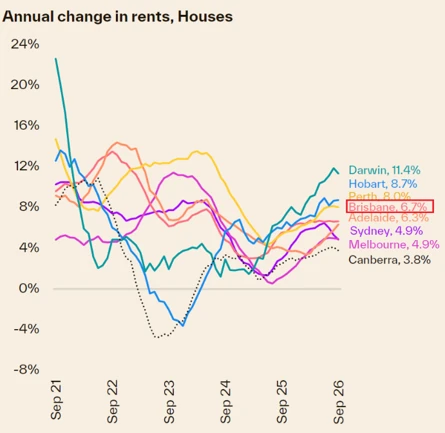 Annual change in rents for houses. Source: Cotality |
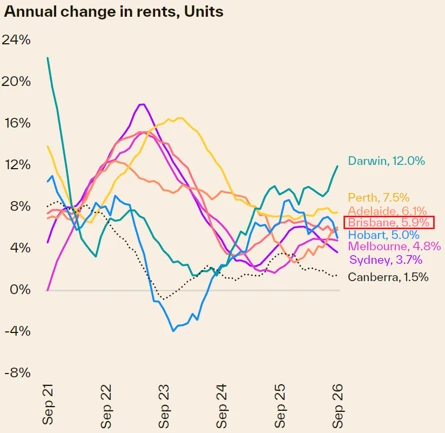 Annual change in rents for units. Source: Cotality |
Brisbane’s rental growth compares well nationally. House rents are rising faster than in Sydney and Melbourne, both at 4.9%, and Canberra at 3.8%, although Darwin, Hobart and Perth recorded stronger growth. Brisbane unit rents rose 5.9%, ahead of Sydney at 3.7% and Melbourne at 4.8%.
Gross yields improved steadily, with houses rising from 3.1% in June to 3.4% and units from 3.9% to 4.2%. Most of this improvement reflects softer values rather than stronger returns. With the cash rate at 4.60% and higher insurance, maintenance and other holding costs, cash flow remains challenging for many investors.
Long-Term Supply Remains Constrained
Queensland dwelling commencements rose 20.0% over the latest twelve months, while completions fell 2.1%. Starts do not translate immediately into completed homes, and high construction costs continue to challenge project feasibility.
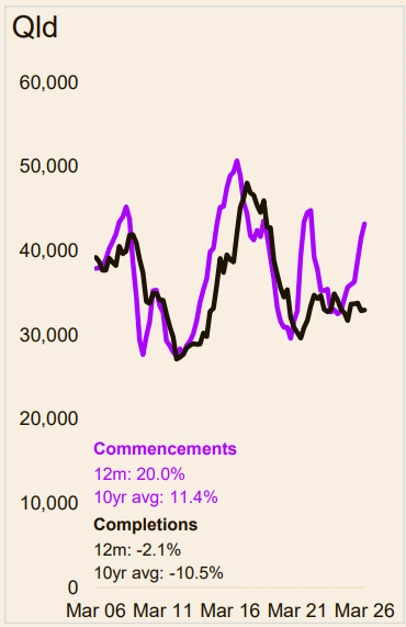
Building commencements vs completions in Queensland. Source: Cotality
Those costs also create a natural floor under established values. If established housing becomes too cheap relative to the cost of building, development stops making financial sense, fewer homes are delivered and established values find support. With major rail, hospital and Olympic-related projects ahead, competition for labour and materials is unlikely to ease.
Outlook
Further softness is likely while buyers adjust to higher rates and weaker confidence, but a slowing market is not a crashing market. A more serious correction would require a significant rise in forced selling, weakening employment, falling migration and a sustained deterioration in underlying demand. None of these is evident on current data. Unemployment remains low, population growth continues, and approximately $10.3 billion of infrastructure, $8 billion of commercial and $2.8 billion of residential development is underway across the city.
Well-located established houses should continue to command a scarcity premium. Brisbane’s development pipeline, valued at approximately $22.7 billion, is weighted heavily towards infrastructure, commercial projects, units and land rather than completed detached homes. Established family homes close to employment, transport, schools and lifestyle amenity will not become materially easier to replace.
As the 2022 experience showed, sentiment can move faster than fundamentals in both directions. Brisbane is also becoming a more fragmented market, as this quarter’s suburb mapping makes clear, and it should not be assessed as one uniform market.
What it means for you
If you are buying, conditions favour prepared buyers. There is more choice, less competition and greater room to negotiate than at any time in recent years. Become finance ready at today’s rates, understand which locations represent genuine value, and be prepared to act, because buyer activity can return quickly once sentiment turns.
If you own and are not selling, be careful about reading too much into a softer median. Much of that movement reflects a change in what is transacting rather than a like-for-like fall in the value of your home, and the qualities that drive long-term value, scarcity, land and location, have not changed.
If you are selling, price realistically from the outset and present the property well. Well-presented properties priced to today’s market are still attracting buyers, while those priced to earlier expectations tend to sit longer.
If you invest, yields are improving and rents continue to rise, but holding costs and policy uncertainty make cash flow the number to model carefully. Focus on scarcity, land content, income durability and long-term utility rather than short-term price movements.
The next phase will reward those who can separate short-term discomfort from permanent impairment in value. Sentiment will shift, and when it does, the market can respond far faster than most people expect.
Buying in Brisbane over the coming months?
Streamline Property Buyers helps buyers identify quality property and negotiate with confidence in a changing market. Book a Discovery Call at streamlineproperty.com.au/contact-us/.
To Read More, Please subscribe to our Monthly Market Updates.
