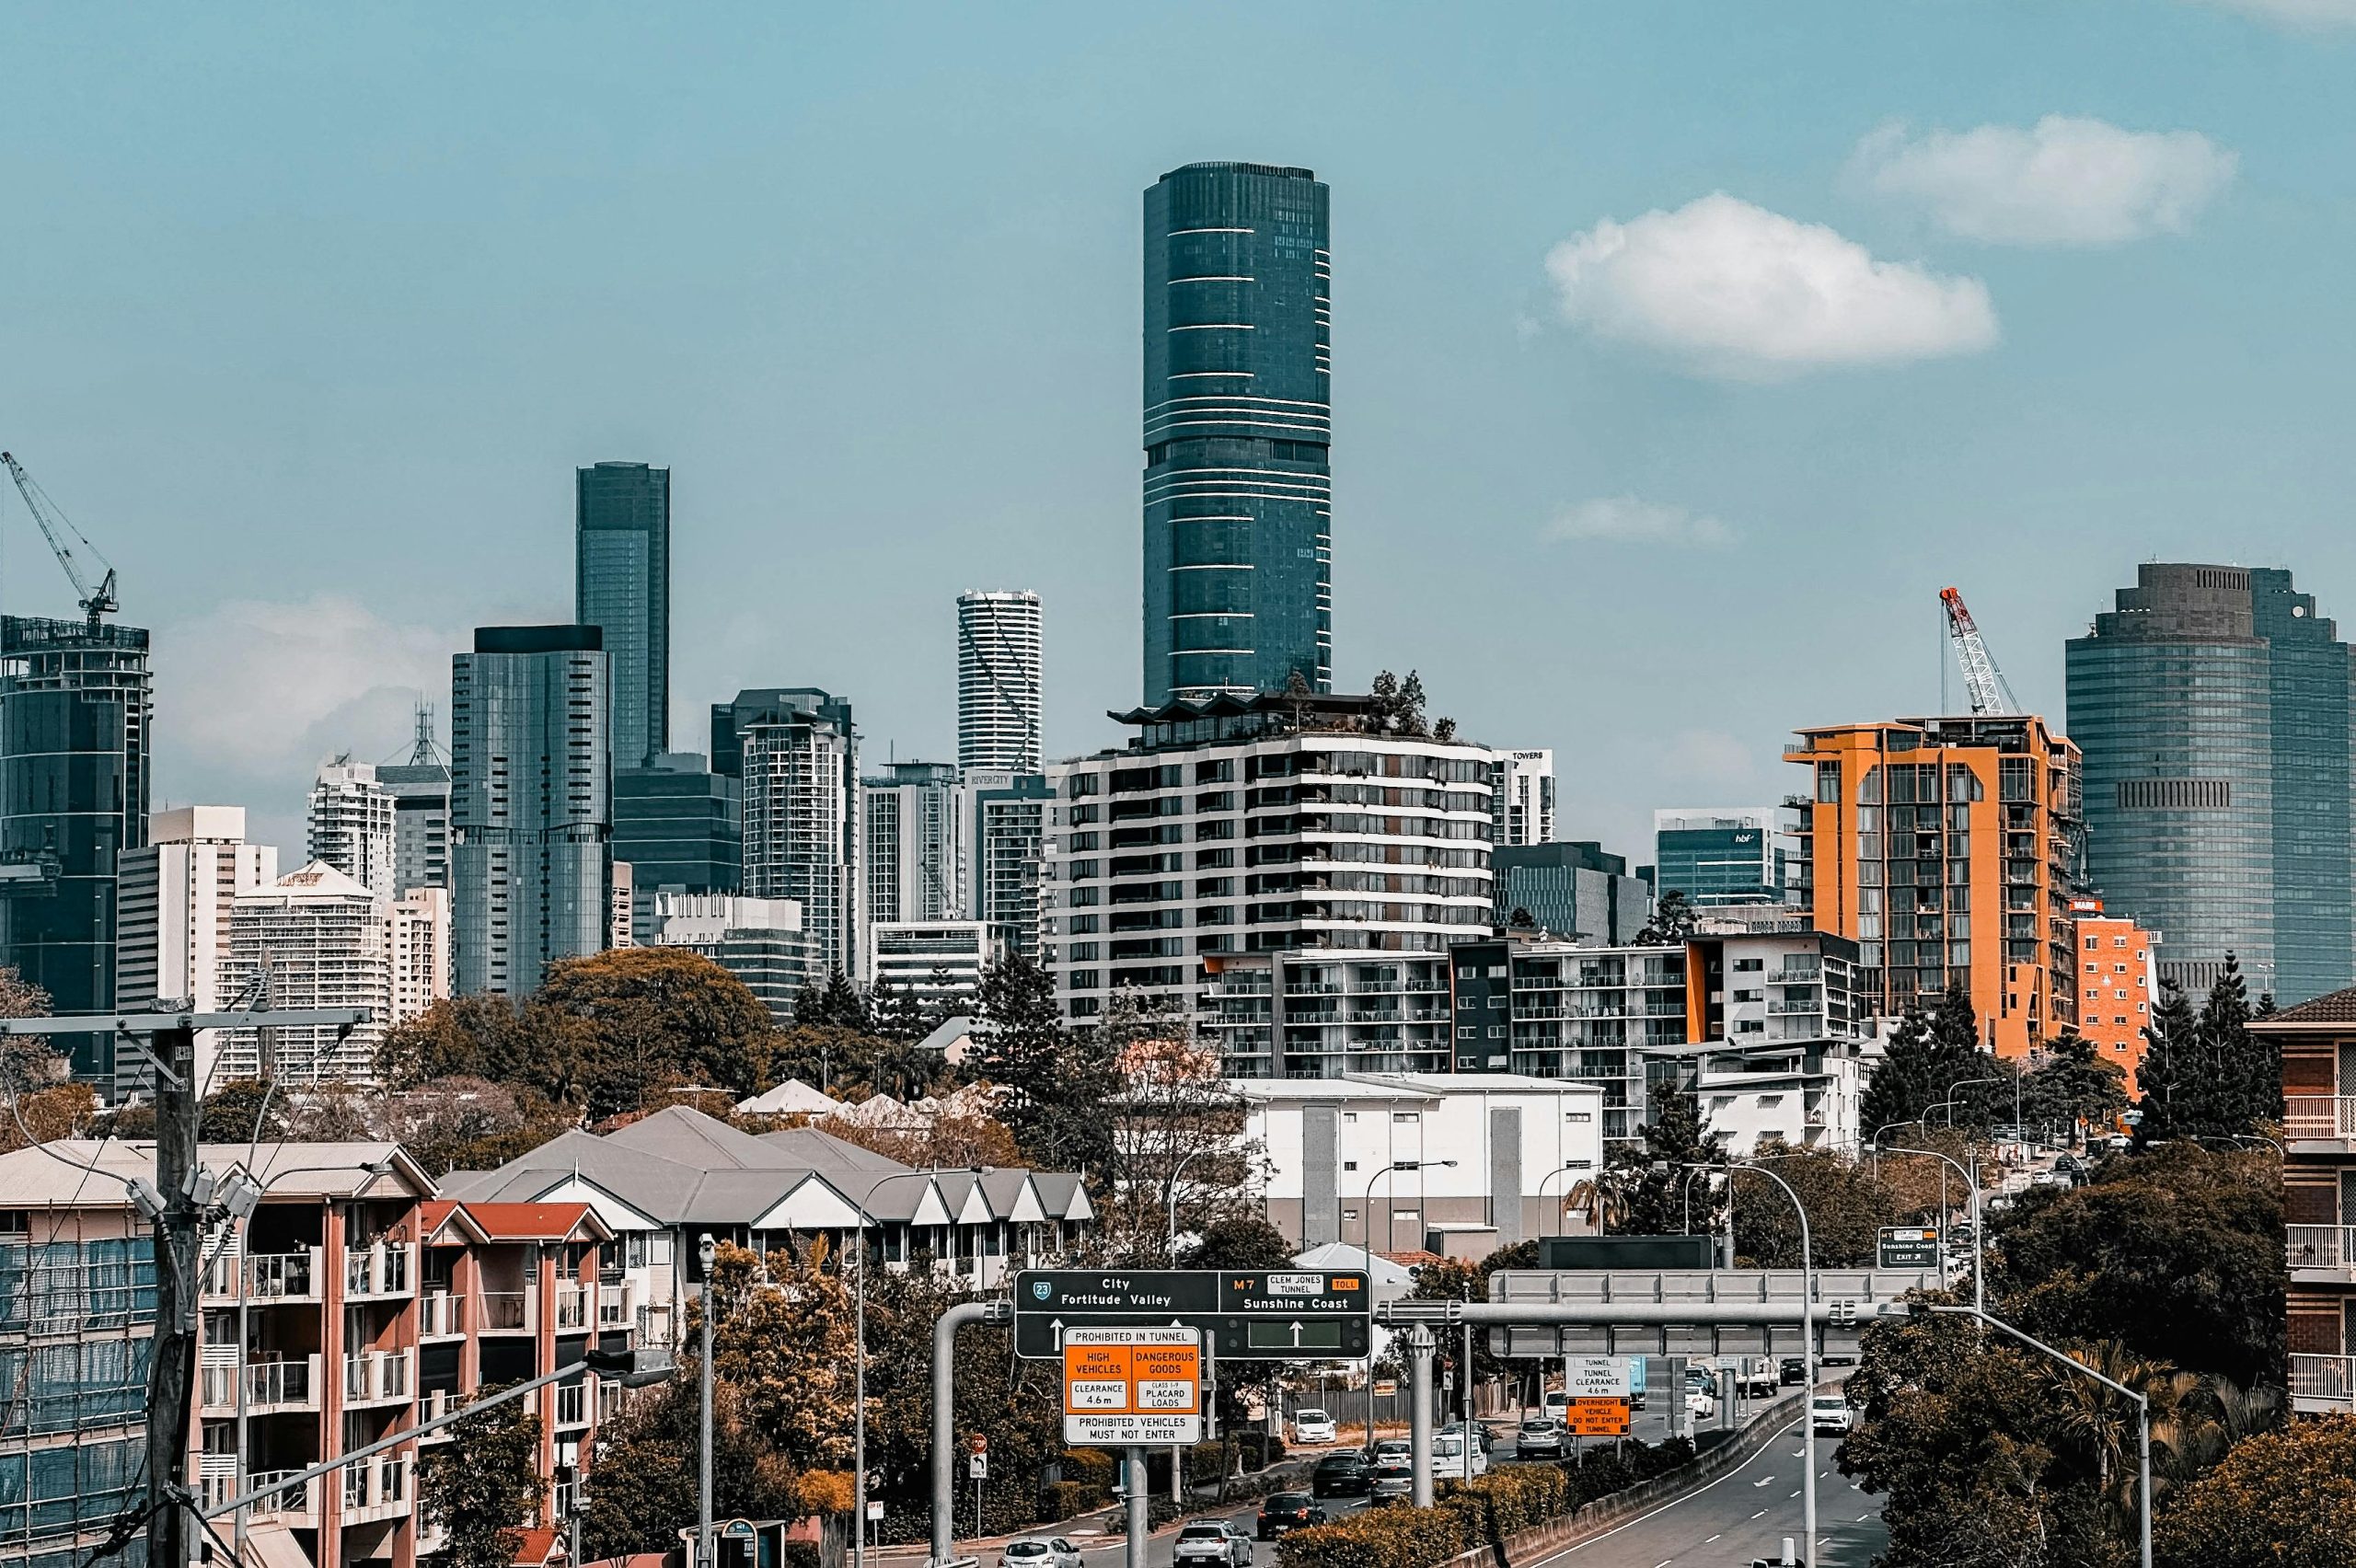
New Farm is not the kind of suburb people stumble into. Buyers who end up here have usually done the research, weighed up the options, and kept coming back to the same address. Sitting just 2km east of the CBD on a wide bend of the Brisbane River, New Farm QLD punches well above its size: 2 square kilometres of tree-lined streets, riverfront parks, art deco apartments, and character homes that rarely hit the open market. This guide cuts through the noise on the suburb’s real estate market, lifestyle, and what to think through carefully before you buying properties.
Key Takeaways
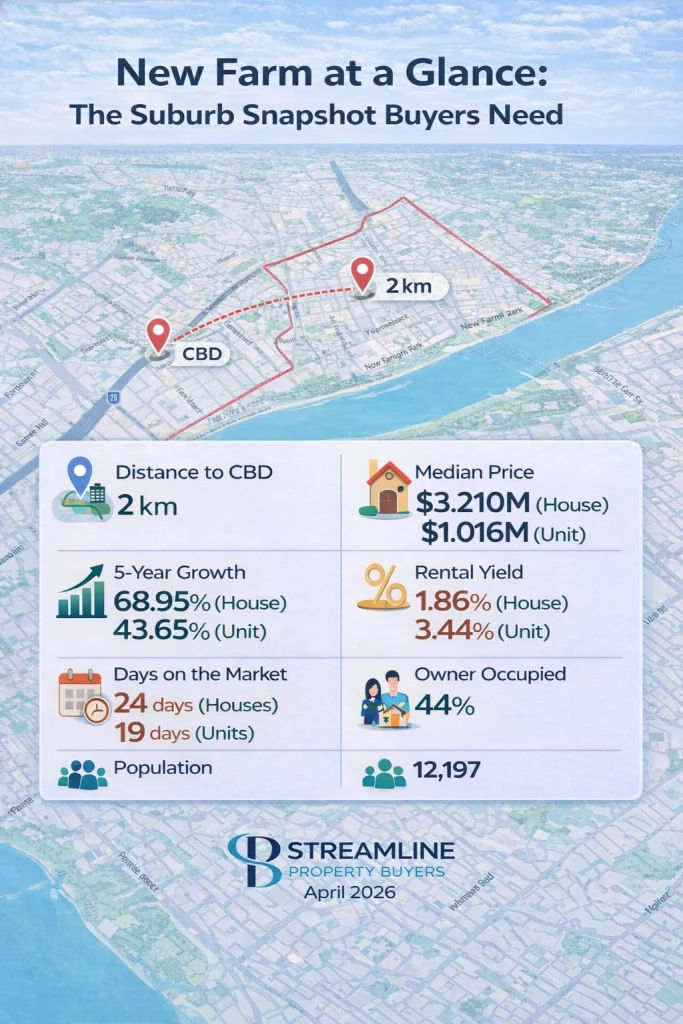
- Location: 2km east of Brisbane CBD; riverside peninsula, accessed from Fortitude Valley and Newstead.
- Median House Price: $3,210,000 (April 2026).
- Median Unit Price: $1,016,350; annual growth of 14.84% (April 2026).
- Days on Market: Houses averaging 24 days; units averaging 19 days (April 2026).
- Rental Yields: Houses at 1.86% ($1,150/week); units at 3.44% ($673/week).
- Demographics: Population 12,197; median age 39; dominated by professionals and childless couples.
- Transport: Two CityCat ferry terminals; BUZ bus routes direct to CBD; walkable to Fortitude Valley.
- Schools: New Farm State School, Holy Spirit School, proximity to All Hallows’ and Brisbane Grammar.
Geography and Local Character
New Farm sits on a riverside peninsula about 2 square kilometres in size, bookended by the Brisbane River on three sides and Fortitude Valley to the northwest. Its history goes back to 1827, when Commandant Patrick Logan set up a farm there as part of the Moreton Bay penal colony. By 2021 it had 12,197 residents packed into that same small footprint, making it one of the most densely settled pockets in the city.
What makes it visually distinct is the housing stock. Brisbane’s largest collection of art deco apartment buildings sits here, alongside Queenslanders, Federation homes, and the odd 19th-century colonial. Separate houses account for just 20.2% of all occupied dwellings, with flats and apartments at 75.8%. Stock is genuinely scarce, and that scarcity does real work on pricing.
Merthyr was its own suburb until 1975 and is now a neighbourhood within New Farm. The retail strip along Merthyr Road still has its own identity, with a village feel that sits apart from the broader suburb.
Transport
Getting around from New Farm without a car is genuinely practical. Two CityCat ferry terminals sit at Sydney Street and New Farm Park, giving residents direct river access to the CBD, South Bank, and beyond.
BUZ bus services 196 and 199 run cross-town via the city centre, with a peak-only service 195 also covering CBD commuters. Residents who prefer rail can walk to Fortitude Valley station in around 10 minutes.
The 2021 Census data backs up just how walkable the suburb is. Only 34.1% of employed residents drove to work as a car driver, well short of the Queensland average of 59.5%. Another 26.5% worked from home, and 9.2% walked to work entirely.
For journey planning, visit translink.com.au.
Education
Child Care Centres
There are 3 child care and early learning centres located within New Farm QLD 4005, offering families convenient access to quality early childhood education:
| Centre / Operator | Address |
| Care For Kyds | 36 Villiers Street, New Farm QLD 4005 |
| Jabiru Kids – New Farm – OSHC program based at New Farm State School | Cnr James and Heal Streets, New Farm QLD 4005 |
| Jack & Jill Child Care Centre | 955 Brunswick Street, New Farm QLD 4005 |
Schools
New Farm has a solid primary school offering within the suburb itself, with well-regarded secondary options close by.
| School | Type | Notes |
| New Farm State School | Public (Prep–6) | Catchment school; established 1901 |
| Holy Spirit School | Catholic Primary (Prep–6) | 36 Villiers Street |
| All Hallows’ School | Catholic Secondary | Fortitude Valley; nearby and well-regarded |
| Fortitude Valley State Secondary College | Public Secondary | Opened 2020; nearest state high option |
| Brisbane Grammar / BGGS | Private Secondary | Short distance; high demand from New Farm families |
The suburb’s highly educated demographic is clear in the Census. At the 2021 count, 47.5% of New Farm residents aged 15 and over held a Bachelor Degree or above, more than double the Queensland average of 21.9%.
Always verify school catchments for a specific address before purchasing. Search by address at qgso.qld.gov.au/maps/edmap.
Amenities and Lifestyle
A lot of suburbs claim lifestyle. New Farm actually has it. The combination of riverfront parks, independent dining, arts programming, and a flat, walkable street grid makes daily life here genuinely pleasant rather than just convenient.
Key drawcards:
- New Farm Park: A heritage-listed 37-acre riverfront park with giant fig trees, rose gardens, cycling paths, a heritage rotunda, and a children’s playground. One of Brisbane’s most visited green spaces.
- Brisbane Powerhouse: A major arts and cultural centre in a converted riverside power station. Hosts theatre, comedy, live music, and the weekly Jan Powers Farmers Markets.
- James Street Precinct: High-end dining, boutique retail, and weekend markets directly at the suburb’s northern edge.
- Merthyr Village: Local cafe strip and specialty shops servicing day-to-day needs along Merthyr Road.
- New Farm Cinema: A well-loved independent cinema with a loyal local following.
- Brisbane Riverwalk: A riverside walking and cycling path connecting New Farm to Newstead, Teneriffe, and further afield.
Buyers who get priced out of New Farm’s house market often end up looking at units within the suburb or moving one street over into Newstead, Teneriffe, or Kangaroo Point, where the lifestyle is similar but the entry price is lower.
What Type of Properties Are in New Farm?
Seven in ten occupied dwellings in New Farm are flats or apartments (74.2%), with separate houses at just 20.9% and townhouses or semi-detached at 4.5%. The average dwelling has 2.3 bedrooms. One and two-bedroom configurations dominate: 20.5% of occupied dwellings have a single bedroom and 40.2% have two.
Houses: The detached stock is mostly post-war Queenslanders, Federation homes, and interwar character properties. Riverfront and elevated pockets set the price ceiling. Only 148 house sales were recorded in the past 12 months, which tells you how rarely these properties change hands.
Apartments and units: Art deco buildings from the 1930s and 1940s sit alongside newer high-rise stock. With 164 unit sales in the same period and an average of just 19 days on market, there is no shortage of buyer interest in this segment.
New development rarely arrives here. Character overlays and limited redevelopment sites keep new supply boutique and infrequent, which is one reason price floors in both segments have held up over time.
Is New Farm a Good Suburb to Invest In?
New Farm’s Property Market Performance
The short answer is that houses and units are doing very different things right now, and the answer depends entirely on which segment you are looking at.
| Houses | Units | |
| Median Price | $3,210,000 | $1,016,350 |
| 3 mo. Change | -4.89% (-$165,000) | 5.87% ($56,350) |
| 12 mo. Change | 10.69% ($310,000) | 14.84% ($131,350) |
| 3-Yr Change | 37.77% ($880,000) | 38.09% ($280,350) |
| 5-Yr Change | 68.95% ($1,310,000) | 43.65% ($308,850) |
| 10-Yr Annual Growth (CAGR) | 8.53% | 5.99% |
| 5-Yr Annual Growth (CAGR) | 11.06% | 7.51% |
| Median Rent (per week) | $1,150 | $673 |
| Sales Days on Market | 24 days | 19 days |
| Gross Rental Yield | 1.86% | 3.44% |
Houses: The median sits at $3,210,000, up 10.69% over the past 12 months and down 4.89% in the most recent quarter. Worth noting: only 148 house sales were recorded in that period, which is a thin sample. When volumes are low, a handful of atypical transactions can shift the median significantly in either direction.
Units: A different picture entirely. The median unit price is $1,016,350, up 14.84% annually and 5.87% in the most recent quarter. Stock is moving in 19 days on average, and gross rental yield sits at 3.44% on a $673 weekly median rent. For buyers with an investment focus, this is the more active part of the market right now.
Days on Market
Days on Market is a leading indicator of buyer competition. A lower figure means properties are being snapped up quickly, signalling strong demand relative to supply. The benchmark to watch is 90 days. Properties sitting longer than this tend to attract buyer scepticism. New Farm is comfortably below this threshold for both housing types.
| Days on Market | Houses | Units |
| Current | 24 days | 19 days |
| 3 mo. Change | -7.69% (-2 days) | 11.76% (2 days) |
| 12 mo. Change | -7.69% (-2 days) | 5.56% (1 day) |
| 3-Yr Change | -7.69% (-2 days) | -20.83% (-5 days) |
| 5-Yr Change | -61.90% (-39 days) | -65.45% (-36 days) |
Both segments have structurally improved their days on market over five years, with houses coming down from 63 days and units from 55 days. This compression reflects sustained demand against a backdrop of very limited new supply.
Rental Yield
Rental yield is the estimated gross rental return, calculated by dividing annual rent by the median price. Note that yields typically compress as prices rise. A declining yield is not necessarily a negative; it often reflects strong capital growth outpacing rental increases.
| Rental Yield | Houses | Units |
| Current | 1.86% | 3.44% |
| 3 mo. Change | 5.08% (0.09%) | -3.91% (-0.14%) |
| 12 mo. Change | -2.62% (-0.05%) | -7.03% (-0.26%) |
| 3-Yr Change | -20.51% (-0.48%) | -1.71% (-0.06%) |
| 5-Yr Change | -18.42% (-0.42%) | 17.01% (0.50%) |
A 3.44% gross unit yield is on the modest side by Queensland standards. That is typical for an inner-city suburb like this, where the investment case is built on capital growth and tenant quality rather than yield alone. House yields at 1.86% reflect the high entry price point, though five-year capital appreciation of 68.95% illustrates the wealth-building potential over the medium term.
Key Investment Signals at a Glance
- Units selling in 19 days signals active and competitive buyer demand.
- Unit rental yield of 3.44% is consistent with a premium inner-city market.
- Vacancy rate of 1.61%, well below the 2% threshold indicating high rental demand.
- Stock on Market (SOM%) at just 0.51%, well below the 2% caution level.
- Potential buyers demand up 169.83% over five years, confirming growing market interest.
- 56% of dwellings are renter-occupied, creating a deep and consistent tenant pool.
- New development is constrained by character overlays, protecting price floors in both segments.
When you put those numbers alongside southeast Queensland’s continued population growth and inner Brisbane’s hard limit on new land supply, the medium-to-long-term case for real estate in New Farm holds up well.
Demographics
The 2021 Census put New Farm’s population at 12,197, with a median age of 39. What stands out is the occupational profile. Professionals make up 42% of the suburb’s employed workforce, nearly double Queensland’s rate of 21.4%. Managers account for a further 18%. In practical terms, this is a suburb of lawyers, consultants, healthcare workers, and tech professionals.
Income reflects that. The median weekly household income is $2,307, against $1,675 across Queensland and $1,746 nationally. More than a third of households (33.8%) bring in over $3,000 a week.
On the household composition side, 58.7% of families are couples without children. Couples with children sit at 28.3% and one-parent families at 10.3%. With an average of just 1.9 people per household compared to 2.5 across Queensland, New Farm skews heavily toward smaller households.
Tenure data is worth paying attention to for investors: 56% of occupied private dwellings are rented, well above the Queensland average of 33.1%. Owner-occupiers account for 44%.
Key Demographics Over Time
| 2001 | 2006 | 2011 | 2016 | 2021 | |
| Population | No Data | 11,245 | 11,330 | 12,542 | 12,197 |
| Median Weekly Household Income | No Data | $1,140 | $1,620 | $1,802 | $2,069 |
| Median Monthly Mortgage Repayments | No Data | $1,647 | $2,200 | $2,167 | $2,264 |
| % Owner Occupier | No Data | 35% | 41% | 40% | 44% |
| % Renter | No Data | 65% | 60% | 60% | 56% |
| Total Dwellings | No Data | 6,301 | 6,390 | 6,853 | 6,834 |
| Avg. People per Household | No Data | 1.8 | 1.9 | 1.9 | 1.9 |
The renter proportion has trended downward from 65% in 2006 to 56% in 2021, indicating a gradual shift toward owner-occupation as capital values have risen and the suburb’s desirability has attracted more long-term resident buyers. Median household income has nearly doubled over the same period, reinforcing the suburb’s professional demographic trajectory.
Best Streets vs Areas to Watch in New Farm
| Area | Why |
| Riverfront and elevated pockets | Highest price points; irreplaceable views; tightly held |
| Near New Farm Park and CityCat terminals | Strongest unit demand; fastest days on market |
| Art deco building clusters | Heritage stock; strong owner-occupier and investor appeal |
| Low-lying areas near Downfall Creek | Check Brisbane City Council flood overlay before purchasing |
Properties closest to New Farm Park, the CityCat stops, and the Brisbane Powerhouse attract the most consistent buyer competition across both houses and units. Off-market transactions are common at the top end of this market.
Bulimba Property Buyer Checklist
Before making an offer on any property in New Farm, work through these points:
- Flood overlay check: Verify the specific address via the Brisbane City Council flood awareness map.
- Body corporate review: For units, obtain strata records; older art deco buildings may carry deferred maintenance obligations.
- Character overlays: Check the Brisbane City Plan for any heritage or character constraints before purchasing a renovation target.
- School catchment: Confirm the address via the Queensland school catchment tool.
- Parking restrictions: Parts of New Farm fall under Brisbane’s Central Traffic District; confirm residential permit availability before purchasing.
- Building and pest inspection: For older Queenslanders and Federation homes, commission a pre-purchase building and pest report.
- Transport access: Walk to the nearest CityCat stop and check ferry frequency at translink.com.au.
How Streamline Property Buyers Helps You Find the Right Property in New Farm
New Farm real estate moves quickly and off-market activity is common across all price points. The difference between a well-bought property and a poor outcome often comes down to access, timing, and negotiation rather than simply finding a listing.
At Streamline Property Buyers, we work exclusively for buyers. We access both on-market and off-market opportunities and commercial property options across inner Brisbane, negotiate on your behalf, and carry out the due diligence that protects your decision. If you are serious about buying in New Farm as a home buyer or investor, we can help you approach it with clarity and confidence.
New Farm QLD 4005 | Data as at April 2026
Data sourced from PropTrack via SuburbsFinder (April 2026) and the Australian Bureau of Statistics 2021 Census. Statistics are indicative only. Past performance is not indicative of future results. Readers should conduct independent verification through primary government sources before making any property decisions.
Connect with us today
To book a FREE discovery call ~ Click Here
Follow us on LinkedIn | YouTube | Instagram | TikTok
Tune into our podcast ~ Brisbane Property Podcast
